Machine Learning Tutorial
Machine Learning is a branch of Artificial Intelligence (AI) that enables computer systems to automatically learn and improve their performance using data and algorithms.
Machine learning allows machines to make decisions and predictions through experience (data).
Machine learning has been widely applied in many fields, including recommendation systems, image recognition, speech recognition, financial analysis, and more.
For example, through machine learning, cars can learn how to recognize traffic signs, pedestrians, and obstacles to achieve autonomous driving.
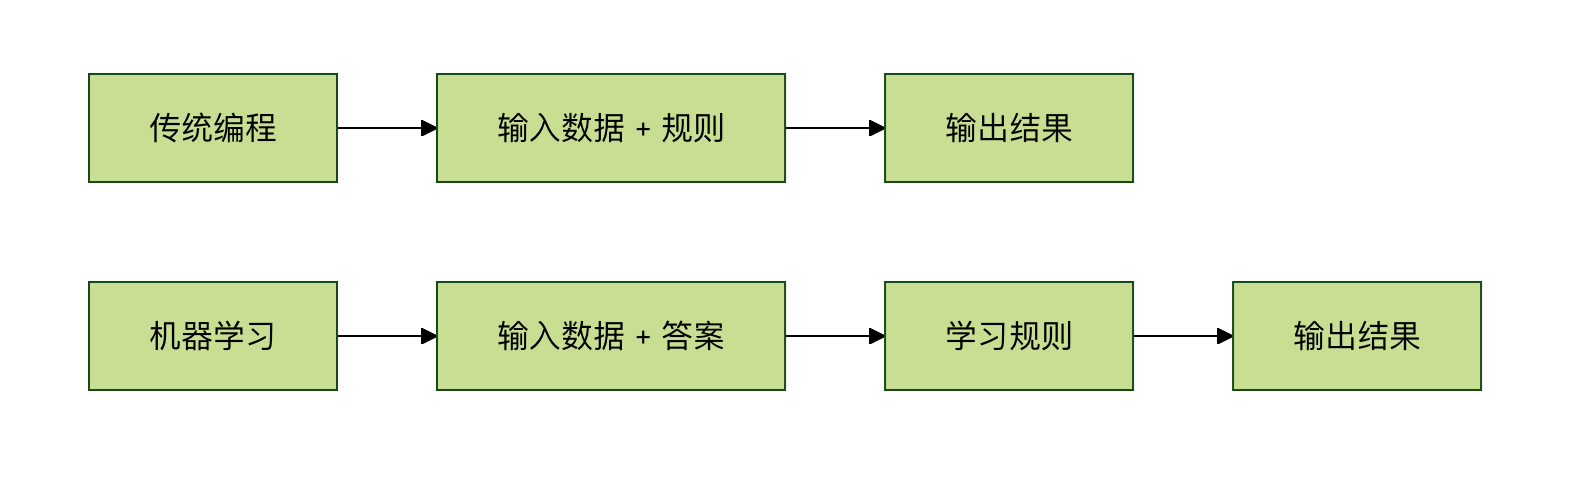
Differences Between Machine Learning and Traditional Programming
| Traditional Programming | Machine Learning |
|---|---|
| Programmers write explicit rules | Computers learn rules from data |
| Suitable for situations where problems are well-defined and rules are clear | Suitable for complex situations where rules are difficult to define |
| Example: Writing a calculator program | Example: Writing a spam email recognition program |
Three Essential Elements of Machine Learning
Machine learning consists of three basic elements:
1. Data
Data is the fuel of machine learning. The higher the quality and the larger the quantity of data, the better the model can typically learn.
- Training data: Data used to teach the model
- Test data: Data used to evaluate the model's learning effectiveness
- Real-world data: New data that the model encounters in real-world applications
2. Algorithm
Algorithms are the learning methods of machine learning; different algorithms are suitable for different types of problems.
- Supervised learning: Learning with labeled answers
- Unsupervised learning: No labeled answers; find patterns by itself
- Reinforcement learning: Learning through trial and error and rewards
3. Model
The model is the result of learning, just like the knowledge a student acquires.
- Training process: The algorithm learns patterns from data
- Inference process: Using the learned patterns to make predictions
Example
Next, we will use a simple example to understand the basic workflow of machine learning.
We will use Python to create a simple linear regression model to predict house prices.
Example
import numpy as np
import matplotlib.pyplot as plt
from sklearn.linear_model import LinearRegression
import seaborn as sns
# Set the chart style to make it look better
sns.set_style("whitegrid")
# -------------------------- Set Chinese font start --------------------------
plt.rcParams['font.sans-serif'] = [
# Windows first
'SimHei', 'Microsoft YaHei',
# macOS first
'PingFang SC', 'Heiti TC',
# Linux first
'WenQuanYi Micro Hei', 'DejaVu Sans'
]
# Fix the issue of negative signs displaying as squares
plt.rcParams['axes.unicode_minus'] = False
# -------------------------- Set Chinese font end --------------------------
# 1. Prepare the data
# Assume we have data on house area and corresponding prices
# House area (square meters)
house_sizes = np.array([50, 60, 70, 80, 90, 100, 110, 120]).reshape(-1, 1)
# House price (ten thousand yuan)
house_prices = np.array([150, 180, 210, 240, 270, 300, 330, 360])
# 2. Create and train the model
# Create a linear regression model
model = LinearRegression()
# Train the model with data (learn the relationship between area and price)
model.fit(house_sizes, house_prices)
# 3. Use the model to make predictions
# Predict the price of an 85 square meter house
predicted_price = model.predict([[85]])
print(f"Predicted price for an 85 square meter house: {predicted_price)
# 4. Visualize the results
plt.scatter(house_sizes, house_prices, color='blue', label='Actual data')
plt.plot(house_sizes, model.predict(house_sizes), color='red', label='Prediction line')
plt.scatter([85], predicted_price, color='green', s=100, label='Prediction point')
plt.xlabel('House area (square meters)')
plt.ylabel('House price (ten thousand yuan)')
plt.title('EXAMPLE Machine Learning Test -- Relationship between House Area and Price')
plt.legend()
plt.grid(True)
plt.show()
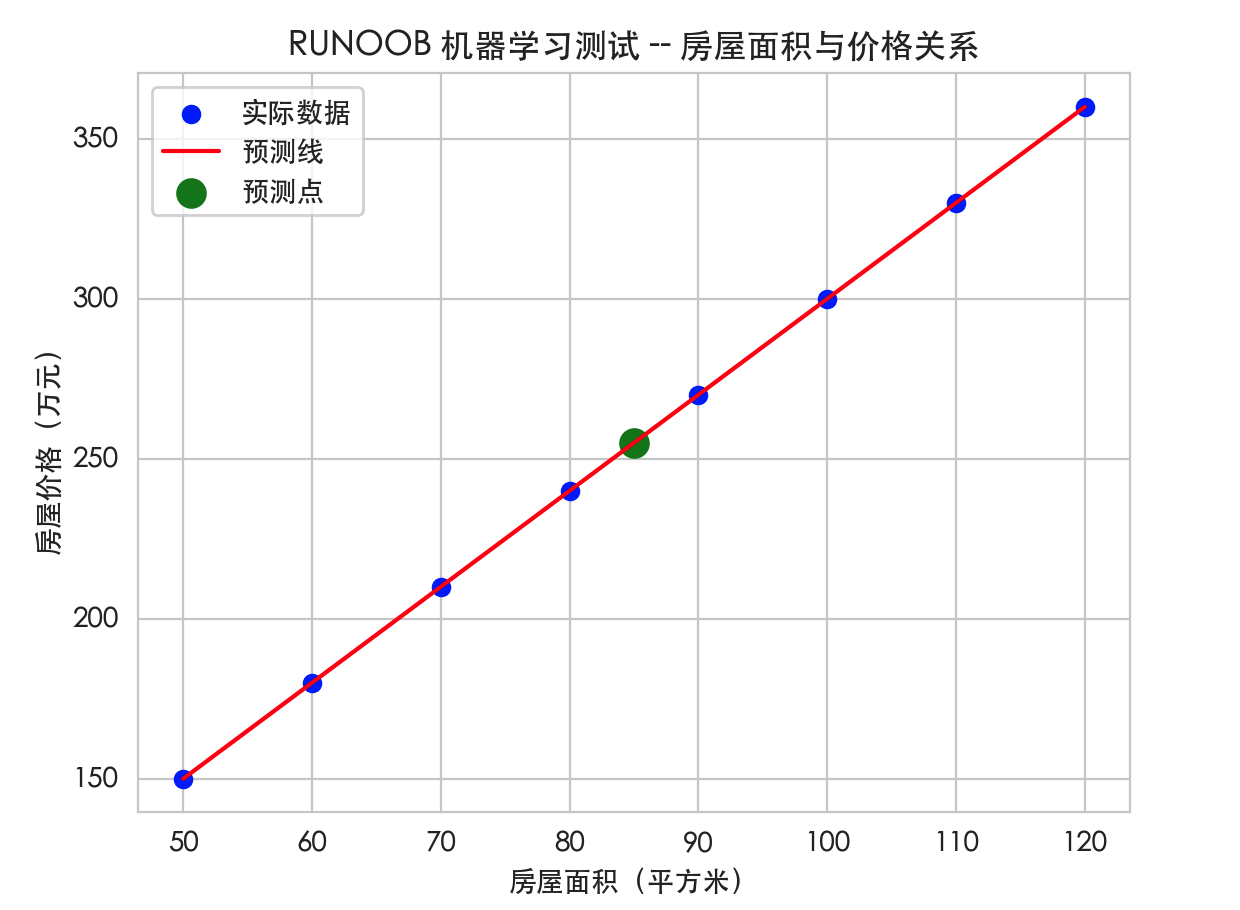
Running result:
85 平方米的房屋预测价格:255.00 万元
This example demonstrates the basic workflow of machine learning:
- Prepare the data (house area and price)
- Choose an algorithm (linear regression)
- Train the model (let the computer learn the relationship between area and price)
- Use the model to predict (predict the price of a new area)
The output chart is as follows: