Feature Engineering
Imagine you are a chef, preparing a delicious dish. The machine learning model is like your "cooking algorithm", and the raw data is the various ingredients you bought from the market: vegetables, meat, seasonings, but some may be covered in mud, some are whole pieces, and some have a strong smell.Feature engineeringis the process of cleaning, cutting, marinating, and combining these raw "ingredients" into "semi-finished products" that can be directly cooked. It is the bridge connecting raw data and machine learning models, and is a key step that determines the upper limit of model performance.
In simple terms,feature engineeringis the process of using domain knowledge, through a series of technical means, to extract, construct, and select features (variables) that are more valuable and easier for machine learning models to learn from raw data.
I. Why is feature engineering so important?
In machine learning projects, the quality of data and features directly determines the upper limit of model performance, while models and algorithms only approach this limit. Excellent feature engineering can:
- Improve model performance: Good features make it easier for the model to discover patterns in the data.
- Accelerate model training: Reducing irrelevant or redundant features can lower computational complexity.
- Enhance model generalization: Prevent the model from overfitting to noise in the training data.
- Adapt to model requirements: Different models have different assumptions about data (e.g., linear models assume linear relationships); feature engineering can make data satisfy these assumptions.
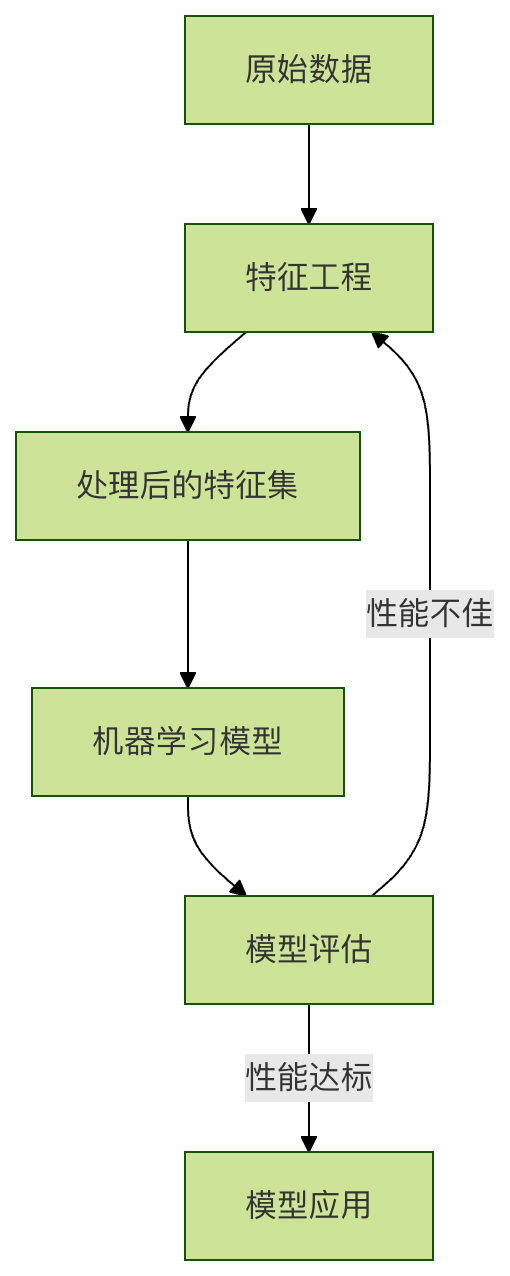
We can use the following flowchart to intuitively understand the position of feature engineering in the entire machine learning pipeline:
II. Core operations of feature engineering
Feature engineering mainly includes three major categories of operations:Feature processing、Feature constructionandFeature selection。
1. Feature processing
This is the most basic step, aiming to "clean" the raw data into a clean and well-organized format.
a) Handling missing values
Missing values often exist in data (e.g.,NaN, NULL), and need to be handled appropriately.
| Handling method | Description | Applicable scenario |
|---|---|---|
| Delete | Directly delete the rows or columns containing missing values | When missing data is very rare, or the feature is unimportant |
| Imputation | Fill with a certain value, such as mean, median, mode, or a special value (e.g., -1) | The most commonly used method, applicable to various situations |
| Interpolation | Use time series or adjacent data points for interpolation calculation | Time series data |
Code example (using Python's pandas library):
Example
import numpy as np
# Create a sample DataFrame with missing values
data = {'age': [25, np.nan, 30, 35, np.nan],
'salary': [50000, 54000, np.nan, 62000, 58000],
'city': ['Beijing', 'Shanghai', 'Guangzhou', np.nan, 'Beijing']}
df = pd.DataFrame(data)
print(“Raw data:”)
print(df)
# 1. Delete missing values (delete any rows containing NaN)
df_dropped = df.dropna()
print("\nAfter removing missing values:")
print(df_dropped)
# 2. Fill missing values
# Fill numeric columns with mean
df_filled = df.copy()
df_filled['age'].fillna(df_filled['age'].mean(), inplace=True)
df_filled['salary'].fillna(df_filled['salary'].mean(), inplace=True)
# Fill categorical columns with mode
df_filled['city'].fillna(df_filled['city'].mode()[0], inplace=True)
print("\nAfter filling missing values:")
print(df_filled)
b) Handling outliers
Outliers are values that are significantly different from most of the data and may interfere with the model. Common detection methods include:
- Standard deviation method: Values outside the range of mean ± 3 times the standard deviation are considered outliers.
- Box plot method: Values less than
Q1 - 1.5*IQRor greater thanQ3 + 1.5*IQRare considered outliers (IQR = Q3 - Q1)。
Handling methods can be deleting, replacing with boundary values, or treating them as missing values.
c) Data standardization/normalization
Many models (such as SVM, KNN, neural networks) are sensitive to feature scales. We need to transform features of different scales to the same scale.
| Method | Formula | Description | Applicable scenario |
|---|---|---|---|
| Standardization | (x - 均值) / 标准差 |
After processing, the data has a mean of 0 and a standard deviation of 1 | When the data distribution is approximately normal |
| Normalization | (x - min) / (max - min) |
Scale the data to the [0, 1] interval | When data boundaries are clear and fast calculation is needed |
Code example (using the scikit-learn library):
Example
import numpy as np
# Sample data
data = np.array([[1000, 25],
[1500, 30],
[800, 20],
[1200, 28]])
# Standardization
scaler_standard = StandardScaler()
data_standardized = scaler_standard.fit_transform(data)
print("Standardized data (mean ~ 0, standard deviation ~ 1):")
print(data_standardized)
print(f"Mean: {data_standardized.mean(axis=0)}")
print(f"Standard deviation: {data_standardized.std(axis=0)}")
# Normalization
scaler_minmax = MinMaxScaler()
data_normalized = scaler_minmax.fit_transform(data)
print("\nNormalized data (range [0,1]): ")
print(data_normalized)
2. Feature construction
Create new, more predictive features by combining or transforming existing features.
a) Transform numerical features
- Polynomial features: Create squares, cubes, etc. of features to help linear models learn nonlinear relationships.
- Binning: Divide continuous age into intervals such as "young", "middle-aged", "old", discretizing continuous data.
- Mathematical transformation: Use transformations like logarithm, exponential, etc. to change the data distribution.
b) Encode categorical features
Machine learning models cannot directly process text such as "Beijing", "Shanghai". They need to be converted to numbers.
| Method | Description | Characteristics |
|---|---|---|
| Label encoding | Assign a unique integer to each category, e.g.,北京:0, 上海:1 |
Simple, but may introduce incorrect order relationships (the model may think 1>0) |
| One-hot encoding | Create a new binary feature (0 or 1) for each category | Can eliminate order misunderstanding, but if there are many categories, it will cause feature dimension explosion |
Code example:
Example
from sklearn.preprocessing import LabelEncoder, OneHotEncoder
# Sample data
df_cat = pd.DataFrame({'city': ['Beijing', 'Shanghai', 'Guangzhou', 'Beijing', 'Shenzhen']})
# Label encoding
le = LabelEncoder()
df_cat['city_label_encoding'] = le.fit_transform(df_cat['city'])
print("Label encoding result:")
print(df_cat)
# One-hot encoding
# Method 1: Use pandas get_dummies
df_onehot_pd = pd.get_dummies(df_cat['city'], prefix='city')
print("\nUse pandas for one-hot encoding: ")
print(df_onehot_pd)
# Method 2: Use sklearn's OneHotEncoder (more commonly used in pipelines)
ohe = OneHotEncoder(sparse_output=False) # sparse_output=False returns an array instead of a sparse matrix
encoded_array = ohe.fit_transform(df_cat[['city']]) # Note that the input must be 2D
print("\nOne-hot encoding using sklearn (array form):")
print(encoded_array)
print("New feature name:", ohe.get_feature_names_out())
3. Feature selection
Select the most important subset from all features to reduce dimensions and reduce the risk of overfitting.
| Method | Description |
|---|---|
| Filter method | Rank and filter based on statistical correlation between features and target variable (e.g., variance, chi-square test, mutual information). Independent of any model. |
| Wrapper method | Treat feature selection as a search problem, using model performance as the evaluation criterion (e.g., Recursive Feature Elimination, RFE). Better results, but high computational cost. |
| Embedded method | Perform feature selection automatically during model training (e.g., L1 regularization LASSO regression, tree model feature importance). |
Code example (selecting based on feature importance):
Example
from sklearn.ensemble import RandomForestClassifier
import pandas as pd
import matplotlib.pyplot as plt
# Load dataset
data = load_breast_cancer()
X = pd.DataFrame(data.data, columns=data.feature_names)
y = data.target
# Train a random forest model, which will compute feature importance
model = RandomForestClassifier(n_estimators=100, random_state=42)
model.fit(X, y)
# Get feature importance
importances = model.feature_importances_
feature_importance_df = pd.DataFrame({
'Feature': data.feature_names,
'Importance': importances
}).sort_values('Importance', ascending=False)
print("Feature importance ranking:")
print(feature_importance_df.head(10)) # View the top 10 most important features
# Visualization
plt.figure(figsize=(10, 6))
plt.barh(feature_importance_df['Feature'][:10], feature_importance_df['Importance'][:10])
plt.xlabel('Feature importance')
plt.title('Top 10 Feature Importance')
plt.gca().invert_yaxis() # Put the most important at the top
plt.show()
# Suppose we select features with importance greater than 0.03
selected_features = feature_importance_df[feature_importance_df['Importance'] > 0.03]['Feature'].tolist()
print(f"\n" Filtered features: {selected_features}")
III. Practical Exercise: Process a Simple Dataset by Hand
Task: Perform basic feature engineering on the famous Titanic passenger dataset to prepare for predicting passenger survival.
Step Hints:
- Load the data (you can use
seabornfrom the libraryload_dataset('titanic'))。 - Observe the data: check feature types and missing values.
- Feature processing:
- Handle missing values (e.g., fill with median
age, fill with modeembarked)。 - will
sex(Sex) feature usinglabel encodingorone-hot encoding。 - Pair
age(Age) usingbinning, create a new age group feature.
- Handle missing values (e.g., fill with median
- Feature construction:
- Combine
sibsp(number of siblings/spouses) andparch(number of parents/children) to construct a newfamily_size(family size) feature.
- Combine
- Feature selection:
- Remove features you think are clearly irrelevant (e.g.,
passenger_id,name,ticket)。 - Try calculating the correlation between numerical features and the survival target, and filter features.
- Remove features you think are clearly irrelevant (e.g.,
Through this exercise, you will experience firsthand how raw data becomes more "friendly" to machine learning models through step-by-step feature engineering.
Summary
Feature engineering is a craft in machine learning that combinesart(domain knowledge, experience, intuition) andscience(statistical methods, algorithms). It has no fixed rules; it requires repeated trial and iteration based on the specific data, problem, and model. For beginners, mastering the basic methods introduced in this article and practicing diligently will lay the strongest foundation for building effective machine learning models. Remember,excellent models often come from excellent features。
Other Extensions