Decision Tree
Decision Tree is a commonly used machine learning algorithm, widely applied to classification and regression problems.
The decision tree represents the decision-making process through a tree structure. Each internal node represents a test on a feature or attribute, each branch represents the outcome of the test, and each leaf node represents a class or value.
Basic Concepts of Decision Tree
- Node: Each point in the tree is called a node. The root node is the starting point of the tree, internal nodes are decision points, and leaf nodes are the final decision results.
- Branch: The path from one node to another is called a branch.
- Split: The process of dividing a dataset into multiple subsets based on a certain feature.
- Purity: Measures whether the classes of samples in a subset are consistent. The higher the purity, the more similar the samples in the subset.
How Decision Trees Work
The decision tree builds the tree structure by recursively splitting the dataset into smaller subsets. The specific steps are as follows:
- Select the best feature: Select the best feature for splitting based on certain criteria (such as information gain, Gini index, etc.).
- Split the dataset: Divide the dataset into multiple subsets based on the selected feature.
- Recursively build subtrees: Repeat the above process for each subset until a stopping condition is met (such as all samples belonging to the same class, reaching maximum depth, etc.).
- Generate leaf nodes: When the stopping condition is met, generate a leaf node and assign a class or value.
Decision Tree Construction Criteria
When building a decision tree, we need to select the best feature to split. Common criteria include:
1. Information Gain
Used for classification problems, it measures the purity improvement of the dataset after selecting a feature. The calculation formula is:

whereEntropyis the entropy of the dataset, used to measure the uncertainty of the data.
2. Gini Index
Also a splitting criterion for classification problems. The calculation formula is:

where piis the proportion of samples of class i. The smaller the Gini index, the purer the dataset.
3. Mean Squared Error (MSE)
Used for regression problems, it measures the difference between predicted values and actual values.
The smaller the MSE, the better the prediction performance of the regression tree.
Pros and Cons of Decision Trees
Advantages
- Easy to understand and interpret: The structure of a decision tree is intuitive and easy to understand and interpret.
- Handle multiple data types: Can handle numerical and categorical data.
- No need for data standardization: Decision trees do not require standardization or normalization of data.
Disadvantages
- Prone to overfitting: Decision trees are prone to overfitting, especially when the dataset is small or the tree depth is large.
- Sensitive to noise: Decision trees are sensitive to noisy data, which may degrade model performance.
- Unstable: Small changes in the data can lead to a completely different tree.
Implementing Decision Tree with Python
Next, we will use Python'sscikit-learnlibrary to implement a simple decision tree classifier.
1. Install the Required Libraries
First, make sure you have installedscikit-learnlibrary. If not, you can install it with the following command:
pip install scikit-learn
2. Import Libraries and Load Dataset
We will usescikit-learnthe built-in Iris dataset to demonstrate the use of decision trees.
Example
from sklearn.model_selection import train_test_split
from sklearn.tree import DecisionTreeClassifier
from sklearn.metrics import accuracy_score
# Load the Iris dataset
iris = load_iris()
X = iris.data
y = iris.target
# Split the dataset into training and test sets
X_train, X_test, y_train, y_test = train_test_split(X, y, test_size=0.3, random_state=42)
3. Train the Decision Tree Model
Next, we useDecisionTreeClassifierto train the decision tree model.
Example
clf = DecisionTreeClassifier()
# Train the model
clf.fit(X_train, y_train)
4. Prediction and Evaluation
Use the trained model to predict the test set and evaluate the accuracy of the model.
Example
y_pred = clf.predict(X_test)
# Calculate accuracy
accuracy = accuracy_score(y_test, y_pred)
print(f"Model accuracy: {accuracy:.2f}")
Output result:
模型准确率: 1.00
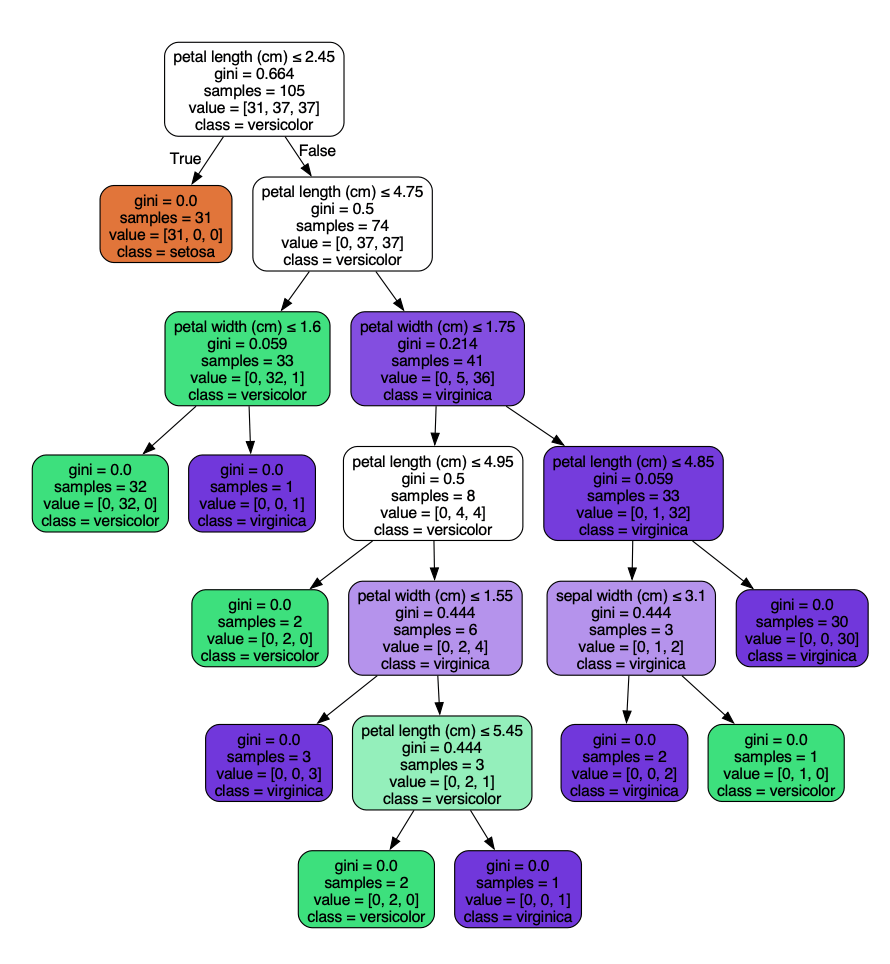
5. Visualize the Decision Tree
To understand the structure of the decision tree more intuitively, we can usegraphvizlibrary to visualize the decision tree.
Graphviz download address:https://graphviz.org/download/
- On Windows, you can download the installer package for Windows (.msi file).
- On Linux, you can install using the package manager command, such asapt install graphviz
- macOS installation commandbrew install graphviz。
Alternatively, install from source by downloading the latest source package (.tar.gz file).
tar -zxvf graphviz-<version>.tar.gz
cd graphviz-<version>
./configure
make
sudo make install
After installation, you can verify whether Graphviz was installed successfully with the following command:
dot -V
If the output is similar to the following, the installation was successful:
dot - graphviz version 12.2.1 (20241206.2353)
Installgraphvizlibrary:
Example
Then, use the following code to generate the visualization of the decision tree:
Example
from sklearn.model_selection import train_test_split
from sklearn.tree import DecisionTreeClassifier
from sklearn.metrics import accuracy_score
from sklearn.tree import export_graphviz
import graphviz
# Load the Iris dataset
iris = load_iris()
X = iris.data
y = iris.target
# Split the dataset into training and test sets
X_train, X_test, y_train, y_test = train_test_split(X, y, test_size=0.3, random_state=42)
# Create a decision tree classifier
clf = DecisionTreeClassifier()
# Train the model
clf.fit(X_train, y_train)
# Predict on the test set
y_pred = clf.predict(X_test)
# Calculate accuracy
accuracy = accuracy_score(y_test, y_pred)
print(f"Model accuracy: {accuracy:.2f}")
# Export the decision tree as a dot file
dot_data = export_graphviz(clf, out_file=None,
feature_names=iris.feature_names,
class_names=iris.target_names,
filled=True, rounded=True,
special_characters=True)
# Render the decision tree using graphviz
graph = graphviz.Source(dot_data)
graph.render("iris_decision_tree") # Save as a PDF file
graph.view() # View in browser
Running the above code will generate an iris_decision_tree.pdf file, displayed as follows: