Data Cleaning
In machine learning, we often hear the saying: "Garbage in, garbage out." This vividly illustrates the decisive impact of data quality on model performance.
Imagine you are a chef preparing a delicious meal. Even if your culinary skills are exceptional, if the ingredients are not fresh, contain dirt, or are incomplete, the final dish will inevitably be greatly compromised.
In machine learning,raw datais our "ingredient", anddata cleaningis that crucial "preparation" process. It aims to identify, correct, or remove errors, inconsistencies, duplicates, and incomplete parts in the data, preparing clean, high-quality "ingredients" for the subsequent model "cooking".
This article will systematically introduce you to the core concepts and common methods of data cleaning, and through clear code examples, help you master this essential skill for data scientists.
1. Why is Data Cleaning So Important?
Before diving into technical details, let us first understand why data cleaning is an indispensable part of the machine learning workflow.
1.1 Improve Model Performance and Accuracy
Dirty data (such as outliers and erroneous values) can mislead the model into learning incorrect patterns. Cleaned data allows the model to more accurately capture the true patterns in the data, thereby making more reliable predictions.
1.2 Ensure Reliability of Analysis Results
Whether for exploratory data analysis or final business decisions, conclusions drawn from erroneous data are dangerous. Data cleaning ensures a solid and reliable foundation for analysis.
1.3 Improve Algorithm Stability
Many machine learning algorithms are very sensitive to data quality. For example, distance-based algorithms (such as KNN and SVM) are severely affected by outliers, and missing values can render an entire sample unusable.
1.4 Save Computational Resources and Time
Cleaning out irrelevant and duplicate data can reduce the dataset size, thereby lowering the computational cost and time of model training.
To more intuitively understand the position of data cleaning in the overall machine learning workflow, see the following flowchart:
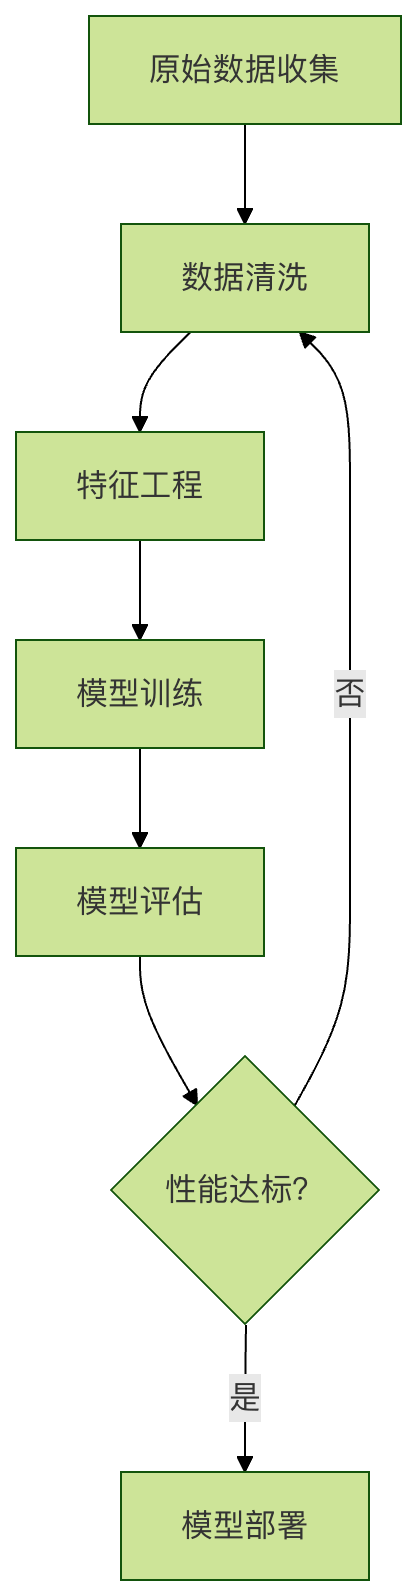
As can be seen from the figure above, data cleaning is the first step of preprocessing, and when model performance is poor, we often need to go back to this step to inspect and improve data quality.
2. Common Data Problems and Cleaning Strategies
Data cleaning typically addresses the following common issues. We can quickly understand them through a simple table:
| Problem Type | Description | Possible Impact | Common Cleaning Strategies |
|---|---|---|---|
| Missing Values | Some fields in a data record have empty values (NaN, NULL). | Leads to samples being discarded, information loss, and calculation errors. | Delete, fill (mean/median/mode/prediction). |
| Outliers | Extreme values that significantly deviate from most of the data. | Distort statistical results and affect model performance. | Identify (IQR, Z-Score) then delete or correct. |
| Duplicate Values | Identical records exist in the dataset. | Causes the model to be overly biased toward duplicate samples, affecting generalization ability. | Identify and remove duplicates. |
| Inconsistencies | Data formats, units, or encodings are inconsistent (e.g., "male", "Male", "M"). | Leads to grouping and analysis errors. | Standardize, normalize, map/convert. |
| Erroneous Values | Values that are clearly illogical (e.g., age is -1 or 300 years old). | Produces meaningless analysis results. | Correct based on business logic or set as missing. |
Next, we will use Python'spandasandnumpylibrary to demonstrate how to solve these problems with specific code.
3. Hands-on Practice: Data Cleaning with Python
Suppose we have acustomer_data.csvcustomer dataset that contains some typical data quality issues.
3.1 Environment Preparation and Data Loading
First, ensure you have installed the necessary libraries, then load the data.
Example
import pandas as pd
import numpy as np
# Load the dataset
df = pd.read_csv('customer_data.csv') # Replace with your file path
# View basic information and the first few rows of the data
print(Dataset shape (rows, columns):, df.shape)
print("\nFirst 5 rows of data:)
print(df.head())
print("\nBasic data information:)
print(df.info())
print("\nStatistical description of the data:)
print(df.describe())
3.2 Handling Missing Values
Finding missing values is the first step.pandasprovides convenient methods.
Example
print(Number of missing values per column:)
print(df.isnull().sum())
# 2. Handle missing values - Method 1: Delete
# Delete any rows containing missing values (suitable when there are few missing values)
df_dropped = df.dropna()
print(f"\nAfter removing missing values, data shape: {df_dropped.shape})
# 3. Handle missing values - Method 2: Imputation
# A more common method is to impute based on the column's characteristics
df_filled = df.copy()
# For numeric columns (e.g., 'Age'), fill with the median (more robust to outliers than the mean)
if 'Age' in df_filled.columns:
df_filled['Age'].fillna(df_filled['Age'].median(), inplace=True)
# For categorical columns (e.g., 'City'), fill with the mode (most frequently occurring value)
if 'City' in df_filled.columns:
df_filled['City'].fillna(df_filled['City'].mode()[0], inplace=True)
# For columns that may change over time (e.g., 'Last Purchase Amount'), sometimes filling with 0 makes more business sense
if 'Last Purchase Amount' in df_filled.columns:
df_filled['Last Purchase Amount'].fillna(0, inplace=True)
print("\nAfter imputing missing values, number of missing values per column:)
print(df_filled.isnull().sum())
3.3 Identifying and Handling Outliers
Outlier handling requires caution, as they sometimes represent important special events.
Example
if 'Annual Income' in df_filled.columns:
# Method 1: Use the Interquartile Range (IQR) method to identify
Q1 = df_filled['Annual Income'].quantile(0.25)
Q3 = df_filled['Annual Income'].quantile(0.75)
IQR = Q3 - Q1
lower_bound = Q1 - 1.5 * IQR
upper_bound = Q3 + 1.5 * IQR
# Find outliers
outliers = df_filled[(df_filled['Annual Income'] < lower_bound) | (df_filled['Annual Income'] > upper_bound)]
print(f"\nNumber of 'Annual Income' outliers found using IQR method: {len(outliers)})
# Handle outliers: Here we choose to clip them using the lower and upper bounds (Winsorization)
df_filled['Annual Income'] = np.where(df_filled['Annual Income'] > upper_bound, upper_bound,
np.where(df_filled['Annual Income'] < lower_bound, lower_bound, df_filled['Annual Income']))
print(The outliers in 'Annual Income' have been clipped.)
3.4 Handling Duplicate Values
Duplicate records increase the computational burden and may introduce bias.
Example
duplicate_rows = df_filled.duplicated()
print(f"\nNumber of fully duplicate rows found: {duplicate_rows.sum()})
# Remove these duplicate rows, keeping only the first occurrence
df_cleaned = df_filled.drop_duplicates()
print(fAfter removing duplicate values, data shape: {df_cleaned.shape})
3.5 Handling Inconsistencies
Ensure the consistency of data formats and values.
Example
if 'City' in df_cleaned.columns:
df_cleaned['City'] = df_cleaned['City'].str.title()
# 2. Map unified values: for example, unify gender information to 'Male' and 'Female'
if 'Gender' in df_cleaned.columns:
gender_mapping = {'male': 'Male', 'female': 'Female', 'M': 'Male', 'F': 'Female'}
df_cleaned['Gender'] = df_cleaned['Gender'].replace(gender_mapping)
# You can also use the .map() function, but .replace() is more flexible, as unspecified values remain unchanged
# 3. Convert data types: ensure numeric columns are of numeric type
if 'Age' in df_cleaned.columns:
df_cleaned['Age'] = pd.to_numeric(df_cleaned['Age'], errors='coerce') # errors='coerce' converts errors to NaN
# After conversion, you can again use the median to fill the new NaN generated by conversion
df_cleaned['Age'].fillna(df_cleaned['Age'].median(), inplace=True)
print("\nData cleaning complete! View the first 5 rows of the cleaned data: ")
print(df_cleaned.head())
4. Summary and Best Practices
Through the above steps, we have completed a round of basic data cleaning. Remember, data cleaning is not a one-time step, but an iterative process. Here are some best practices:
- Explore first, then clean: Before starting cleaning, be sure to use
df.describe()、df.info(), visualization (such as histograms, box plots) and other methods to fully understand your data. - Back up original data: Always keep a copy of the original, unmodified data. All cleaning operations should be performed on the copy.
- Record cleaning steps: Document your cleaning logic (e.g., why use median imputation, how to determine outlier boundaries). This is crucial for project reproducibility and team collaboration.
- Combine with business logic: Data cleaning is not a purely mathematical operation. For example, "age=0" is an error in demographic data, but may be reasonable in infant product data. Always maintain communication with domain experts.
- Proceed iteratively: After cleaning, enter the modeling stage. If the model performs poorly, go back and check data quality, and you may need to adjust the cleaning strategy.
Data cleaning may account for a data science project's60%-80%time. Although tedious, it is the cornerstone of building powerful, reliable machine learning models.
Other Extensions