iOS Memory Management
Introduction
The basic idea of memory management in iOS is reference counting, which controls the lifecycle of memory objects through the object's reference count. In terms of programming practice, there are mainly two approaches:
1: MRR (Manual Retain-Release), manual reference counting. The creation, destruction, and changes to the reference count of objects are all handled by the developer.
2: ARC (Automatic Reference Counting), automatic reference counting. It only handles object creation; developers no longer need to worry about destruction in other processes. It works similarly to garbage collection, but its essence is still reference counting.
Problems Faced
According to Apple's documentation, the two main problems faced are:
Releasing or overwriting data that is still in use. This causes memory corruption, usually resulting in application crashes, or worse, corrupting user data.
Not releasing data that is no longer used leads to memory leaks. Allocated memory that is leaked is not released, even if it is never used again. Leaks cause the application's memory usage to increase over time, which in turn can lead to poor system performance or crashes.
Memory Management Rules
We create our own objects and release them when they are no longer needed.
Retain objects that need to be used. Release these objects when they are no longer necessary.
Do not release objects we do not own.
Using Memory Management Tools
Memory usage can be analyzed with the help of Xcode's Instruments tool. It includes tools such as Activity Monitor, Allocations, Leaks, Zombies, etc.
Steps to Analyze Memory Allocation
1. Open an existing application.
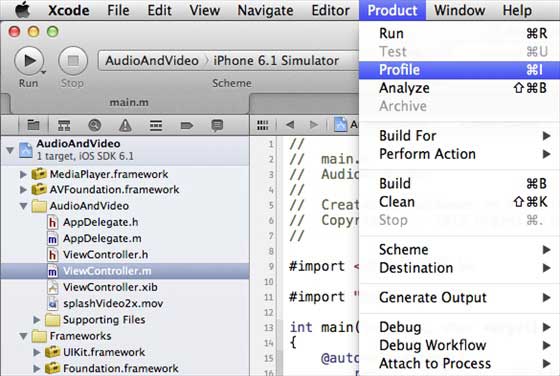
2. Select Product, then Profile as shown below.
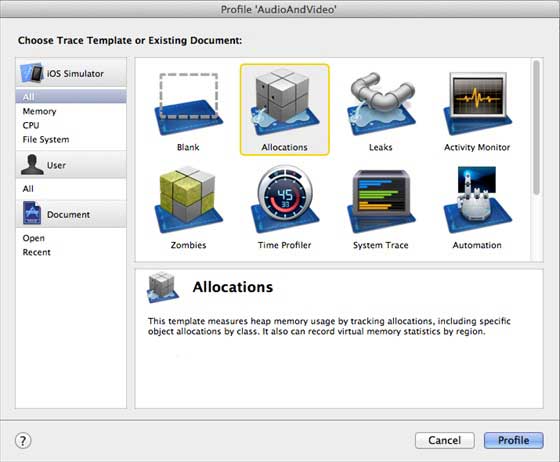
3. Select Allocations and Profile in the following interface.
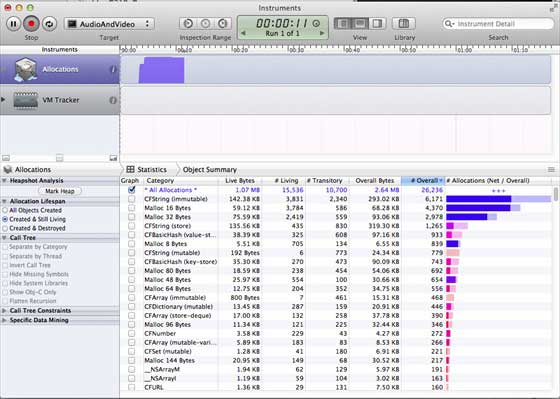
4. We can see the memory usage of different objects.
5. You can switch view controllers to see if memory has been released.
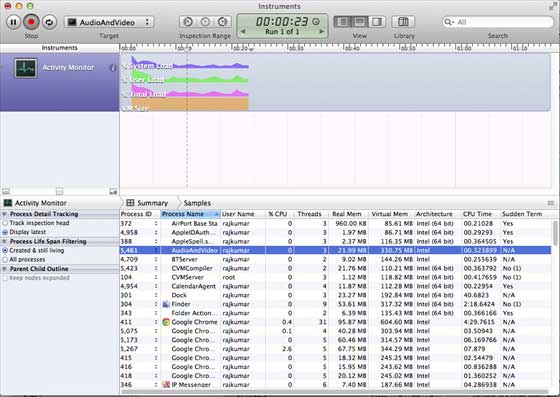
6. Similarly, we can use Activity Monitor to view the memory allocation in the application.
7. These tools can help us understand memory usage and where leaks might occur.
Other Extensions