R Graphics - Scatter Plot
A scatter plot displays all data as points on a Cartesian coordinate system to show the degree of mutual influence between variables. The position of each point is determined by the values of the variables, and each point corresponds to an X and Y axis coordinate.
Scatter plots can be drawn using the plot() function. The syntax format is as follows:
plot(x, y, type="p", main, xlab, ylab, xlim, ylim, axes)
xThe data set for the horizontal x-axis
yThe data set for the vertical y-axis
- type: the type of plot. p for points, l for lines, o draws both points and lines, and the line passes through the points.
mainThe chart title.
xlab、ylabThe label names for the x and y axes.
xlim、ylimThe ranges of the x and y axes.
axesA boolean value indicating whether to draw two x axes.
The selectable values for the type parameter are:
- p: point plot
- l: line plot
- b: draw both points and lines
- c: draw only the line shown by parameter b
- o: draw both points and lines, with the line passing through the points
- h: draw vertical lines from points to the horizontal axis
- s: step plot, horizontal first then vertical
- S: step plot, vertical first then horizontal
- n: empty plot
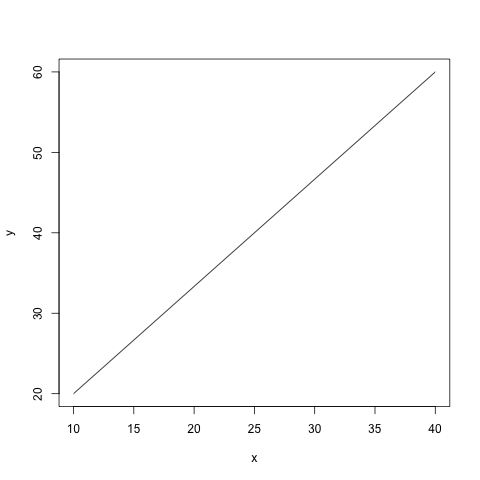
Create a simple line plot:
Example
y<-c(20,60)
# Generate png image
png(file = "runnob-test-plot2.png")
plot(x, y, "l")
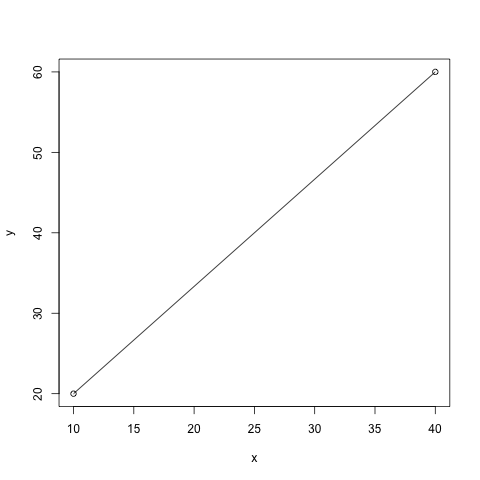
Create a simple line plot. Use o as the type parameter to draw both points and lines, with the line passing through the points:
Example
y<-c(20,60)
# Generate png image
png(file = "runnob-test-plot.png")
plot(x, y, "o")
Next, we use the built-in mtcars dataset in R for testing.
We use the wt and mpg columns of the mtcars dataset:
Example
print(head(input))
The output result is:
wt  mpg
Mazda RX4         2.620 21.0
Mazda RX4 Wag     2.875 21.0
Datsun 710        2.320 22.8
Hornet 4 Drive    3.215 21.4
Hornet Sportabout 3.440 18.7
Valiant           3.460 18.1
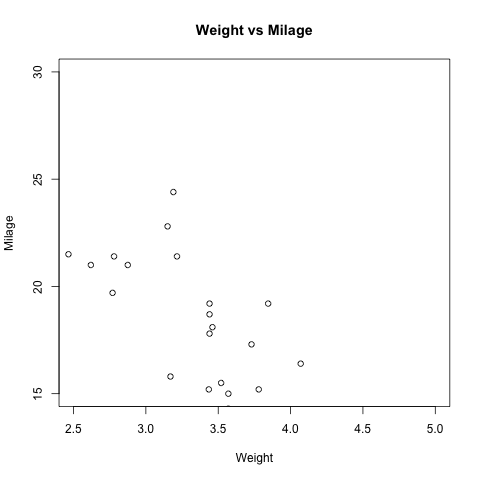
Then we use the above data to generate a scatter plot.
:Example
input <- mtcars[,c('wt','mpg')]
# Generate png image
png(file = "scatterplot.png")
# Set the x-axis range from 2.5 to 5 and the y-axis range from 15 to 30.
plot(x = input$wt,y = input$mpg,
xlab = "Weight",
ylab = "Milage",
xlim = c(2.5,5),
ylim = c(15,30),
main = "Weight vs Milage"
)
Scatter Plot Matrix
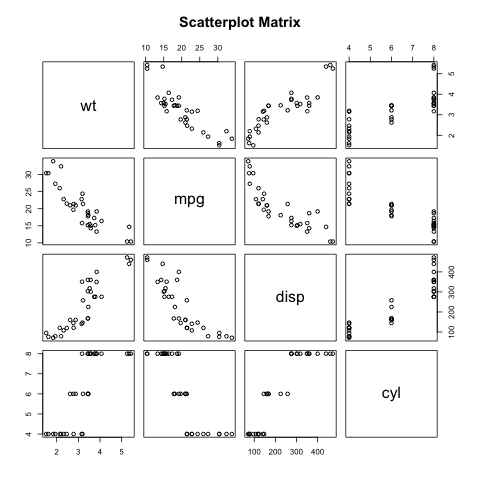
A scatter plot matrix is a plotting method based on two-variable scatter plots. It can be seen as a large square matrix of plots, where each non-diagonal element position shows the scatter plot of the variable in the corresponding row versus the variable in the corresponding column. The diagonal element positions contain the variable names. In this way, the scatter plot matrix clearly shows the pairwise correlations among multiple variables under study.
A scatter plot matrix is simply creating scatter plots for each pair of numeric variables in the dataset.
R uses the following function to create a scatter plot matrix:
pairs(formula, data)
Parameters:
formulaVariable series
dataThe dataset of variables
Example
png(file = "scatterplot_matrices.png")
# 4 variables draw the matrix, 12 plots
pairs(~wt+mpg+disp+cyl,data = mtcars, main = "Scatterplot Matrix")