R Data Frame
A data frame (Data frame) can be understood as what we commonly call a "table".
A data frame is a data structure in R, a special two-dimensional list.
Each column of a data frame has a unique column name, and the lengths are all equal. Data types within the same column must be consistent, while different columns can have different data types.
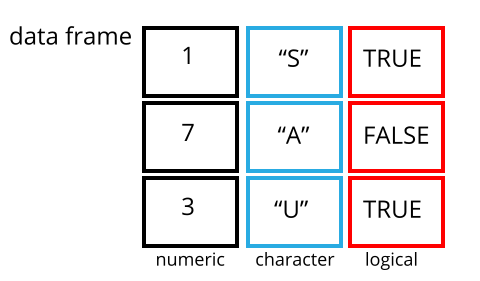
R language data frames are created using the data.frame() function, with the following syntax:
data.frame(…, row.names = NULL, check.rows = FALSE,
           check.names = TRUE, fix.empty.names = TRUE,
           stringsAsFactors = default.stringsAsFactors())
- …: Column vector, can be any type (character, numeric, logical), usually expressed in the form tag = value, or can be value.
- row.names: Row names, default is NULL, can be set to a single number, string, or a vector of strings and numbers.
- check.rows: Check whether row names and lengths are consistent.
- check.names: Check whether the variable names of the data frame are valid.
- fix.empty.names: Set whether unnamed parameters are automatically named.
- stringsAsFactors: Boolean value, whether characters are converted to factors. The factory-fresh default is TRUE, and can be modified by setting the option (stringsAsFactors=FALSE).
The following creates a simple data frame, containing name, employee ID, and monthly salary:
Example
Name= c("Zhang San", "Li Si"),
Employee ID= c("001","002"),
Monthly salary= c(1000, 2000)
)
print(table) # View table data
Executing the above code outputs the following result:
姓名 工号 月薪
1 张三  001 1000
2 李四  002 2000
The data structure of a data frame can be displayed by using thestr()function to display:
Example
Name= c("Zhang San", "Li Si"),
Employee ID= c("001","002"),
Monthly salary= c(1000, 2000)
)
# Get data structure
str(table)
Executing the above code outputs the following result:
'data.frame':   2 obs. of  3 variables:
 $ 姓名: chr  "张三" "李四"
 $ 工号: chr  "001" "002"
 $ 月薪: num  1000 2000
summary()The summary information of the data frame can be displayed:
Example
Name= c("Zhang San", "Li Si"),
Employee ID= c("001","002"),
Monthly salary= c(1000, 2000)
)
# Display summary
print(summary(table))
Executing the above code outputs the following result:
姓名               工号                月薪
Length:2           Length:2           Min.   :1000
Class :character   Class :character   1st Qu.:1250
Mode  :character   Mode  :character   Median :1500
                                      Mean   :1500
                                      3rd Qu.:1750
                                      Max.   :2000
We can also extract specified columns:
Example
Name= c("Zhang San", "Li Si"),
Employee ID= c("001","002"),
Monthly salary= c(1000, 2000)
)
# Extract specified columns
result <- data.frame(table$Name,table$MonthlySalary)
print(result)
Executing the above code outputs the following result:
table.姓名 table.月薪
1       张三       1000
2       李四       2000
The following displays the first two rows:
Example
Name= c("Zhang San", "Li Si","Wang Wu"),
Employee ID= c("001","002","003"),
Monthly salary= c(1000, 2000,3000)
)
print(table)
# Extract the first two rows
print("---Output the first two rows----")
result <- table[1:2,]
print(result)
Executing the above code outputs the following result:
姓名 工号 月薪
1 张三  001 1000
2 李四  002 2000
3 王五  003 3000
[1] "---输出前面两行----"
  姓名 工号 月薪
1 张三  001 1000
2 李四  002 2000
We can read the data of a specific column in a specified row using coordinates. Below we read the data in rows 2 and 3, columns 1 and 2:
Example
Name= c("Zhang San", "Li Si","Wang Wu"),
Employee ID= c("001","002","003"),
Monthly salary= c(1000, 2000,3000)
)
# Read data from rows 2 and 3, columns 1 and 2:
result <- table[c(2,3),c(1,2)]
print(result)
Executing the above code outputs the following result:
姓名 工号
2 李四  002
3 王五  003
Extend Data Frame
We can extend an existing data frame. In the following example, we add a department column:
Example
Name= c("Zhang San", "Li Si","Wang Wu"),
Employee ID= c("001","002","003"),
Monthly salary= c(1000, 2000,3000)
)
# Add department column
table$Department<- c("Operations","Technology","Editorial")
print(table)
Executing the above code outputs the following result:
姓名 工号 月薪 部门
1 张三  001 1000 运营
2 李四  002 2000 技术
3 王五  003 3000 编辑
We can use thecbind()function to combine multiple vectors into a data frame:
Example
sites <- c("Google","Example","Taobao")
likes <- c(222,111,123)
url <- c("www.google.com","www.example.com","www.taobao.com")
# Combine vectors into a data frame
addresses <- cbind(sites,likes,url)
# View data frame
print(addresses)
Executing the above code outputs the following result:
     sites    likes url
[1,] "Google" "222" "www.google.com"
[2,] "Example" "111" "www.example.com"
[3,] "Taobao" "123" "www.taobao.com"
If you need to merge two data frames, you can use therbind()function:
Example
Name= c("Zhang San", "Li Si","Wang Wu"),
Employee ID= c("001","002","003"),
Monthly salary= c(1000, 2000,3000)
)
newtable = data.frame(
Name= c(Xiaoming, "Newbie"),
Employee ID= c("101","102"),
Monthly salary= c(5000, 7000)
)
# Merge two data frames
result <- rbind(table,newtable)
print(result)
Executing the above code outputs the following result:
姓名 工号 月薪
1 张三  001 1000
2 李四  002 2000
3 王五  003 3000
4 小明  101 5000
5 小白  102 7000
Other Extensions