R Plotting - Pie Chart
R language provides a large number of libraries to implement plotting functions.
A pie chart, or pie graph, is a circular statistical chart divided into several sectors, used to describe the relative relationships among quantities, frequencies, or percentages.
R language uses the pie() function to create pie charts. The syntax is as follows:pie(x, labels = names(x), edges = 200, radius = 0.8,
clockwise = FALSE, init.angle = if(clockwise) 90 else 0,
density = NULL, angle = 45, col = NULL, border = NULL,
lty = NULL, main = NULL, …)
- x: a numeric vector representing the area of each sector.
- labels: a character vector representing the labels for each sector area.
- edges: this parameter is not very useful; it refers to the number of edges of the polygon (the outline of a circle resembles a polygon with many edges).
- radius: the radius of the pie chart.
- main: the title of the pie chart.
- clockwise: a logical value used to indicate whether the slices of the pie chart are divided clockwise.
- angle: sets the slope of the shading.
- density: the density of the shading. Default value is NULL.
- col: represents the color of each sector, similar to a palette.
To draw a pie chart, you need to prepare: a vector reflecting quantities, labels for each part, and colors for each part (optional).
Next, we will draw a simple pie chart:
Example
info = c(1, 2, 4, 8)
# Naming
names = c("Google", "Example", "Taobao", "Weibo")
# Coloring (optional)
cols = c("#ED1C24","#226AB1","#FFC90E","#3f48CC")
# Plotting
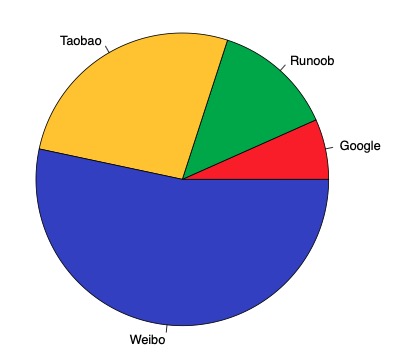
pie(info, labels=names, col=cols)
Running the plotting program will generate a PDF file (Rplots.pdf) in the current directory. Open the file to see the graphic effect as follows:
We can also use the png(), jpeg(), and bmp() functions to set the output file format to an image:
Example
info = c(1, 2, 4, 8)
# Naming
names = c("Google", "Example", "Taobao", "Weibo")
# Coloring (optional)
cols = c("#ED1C24","#226AB1","#FFC90E","#3f48CC")
# Set output image
png(file='example-pie.png', height=300, width=300)
# Plotting
pie(info, labels=names, col=cols)
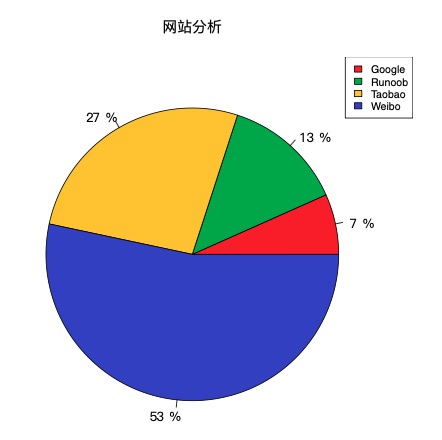
Next, we set a title for the pie chart. For Chinese fonts, you need to set the font parametersfamily='GB1', or you can set your own font library. For details, refer to:R Plotting - Chinese Support。
Example
info = c(1, 2, 4, 8)
# Naming
names = c("Google", "Example", "Taobao", "Weibo")
# Coloring (optional)
cols = c("#ED1C24","#226AB1","#FFC90E","#3f48CC")
# Calculate percentages
piepercent = paste(round(100*info/sum(info)), "%")
# Plotting
pie(info, labels=piepercent, main = "Website Analysis", col=cols, family='GB1')
# Add color sample labels
legend("topright", names, cex=0.8, fill=cols)
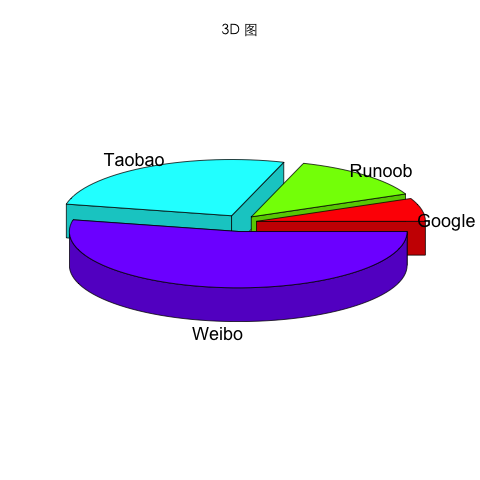
To draw a 3D pie chart, you can use the pie3D() function from the plotrix library. Before using it, we need to install it:
install.packages("plotrix", repos = "https://mirrors.ustc.edu.cn/CRAN/")
Example
library(plotrix)
# Data preparation
info = c(1, 2, 4, 8)
# Naming
names = c("Google", "Example", "Taobao", "Weibo")
# Coloring (optional)
cols = c("#ED1C24","#226AB1","#FFC90E","#3f48CC")
# Set the file name, output as png
png(file = "3d_pie_chart.png")
# Draw 3D chart; family needs to be set to a Chinese font library supported by your system
pie3D(info,labels = names,explode = 0.1, main = "3D Chart",family = "STHeitiTC-Light")
The generated image is shown below: