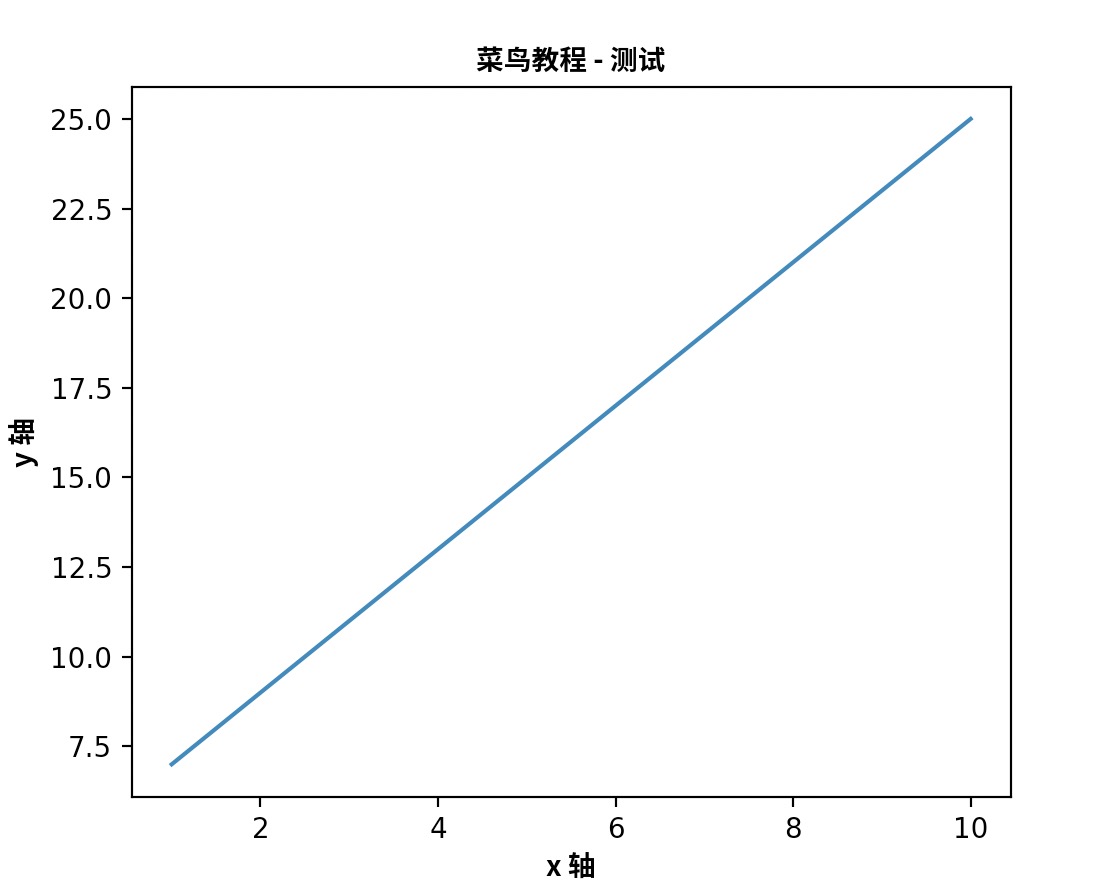
Matplotlib Chinese Display
Matplotlib is not particularly friendly to Chinese display. To display Chinese in Matplotlib, we can use two methods:
- Set Matplotlib's font parameters.
- Download and use a font library that supports Chinese.
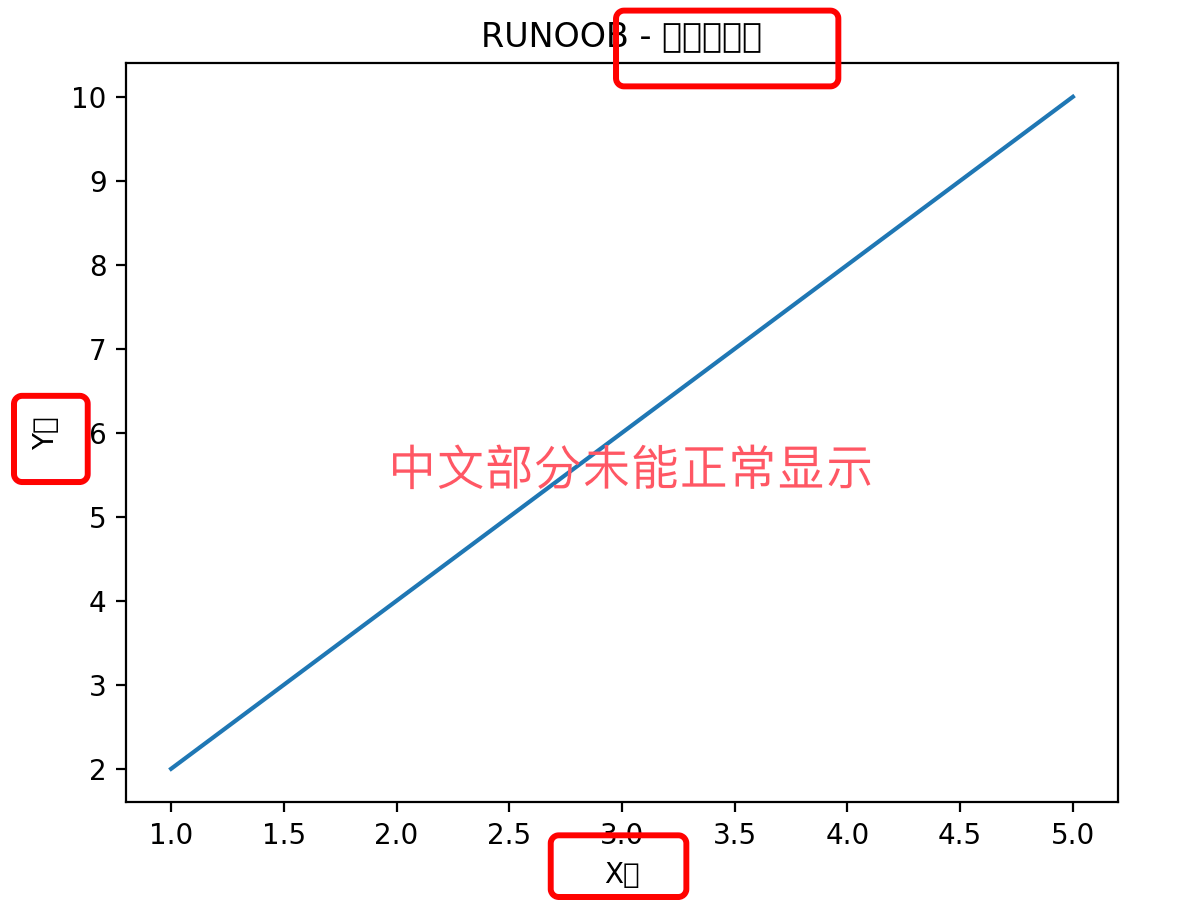
Without setting a font, the default display is as follows, and the Chinese part cannot be displayed normally:
Matplotlib font parameters
We can first get the system's font library list:
Example
import matplotlib
a=sorted([f.name for f in matplotlib.font_manager.fontManager.ttflist])
for i in a:
print(i)
The output result is similar to the following:
...
Heiti TC
Helvetica
Helvetica Neue
Herculanum
Hiragino Maru Gothic Pro
Hiragino Mincho ProN
Hiragino Sans
Hiragino Sans GB
Hoefler Text
...
The above code outputs all registered names in font_manager's ttflist. Find a Chinese font such as STFangsong (FangSong) or Heiti TC (Heiti), then add the following code.
For Windows:
plt.rcParams['font.family'] = 'SimHei' # 替换为你选择的字体
On Windows, select SimHei (Heiti) or another Chinese font, and set it as Matplotlib's default font.
For Linux:
plt.rcParams['font.family'] = 'WenQuanYi Micro Hei' # 替换为你选择的字体
On Linux, use the fc-list command to view installed fonts, choose a Chinese font, and set it as Matplotlib's default font.
For macOS:
plt.rcParams['font.family'] = 'Heiti TC' # 替换为你选择的字体
By settingplt.rcParams['font.family'], you tell Matplotlib to use the selected font to render text, thereby displaying Chinese correctly in the chart.
In this way, you can use the system-supported Chinese fonts in Matplotlib charts.
Example
plt.rcParams['font.family'] = 'Heiti TC' # Replace with the font you chose
# Create data
x = [1, 2, 3, 4, 5]
y = [2, 4, 6, 8, 10]
# Plot line chart
plt.plot(x, y)
# Add title and labels
plt.title('Line chart example')
plt.xlabel('X-axis')
plt.ylabel('Y-axis')
# Display the plot
plt.show()
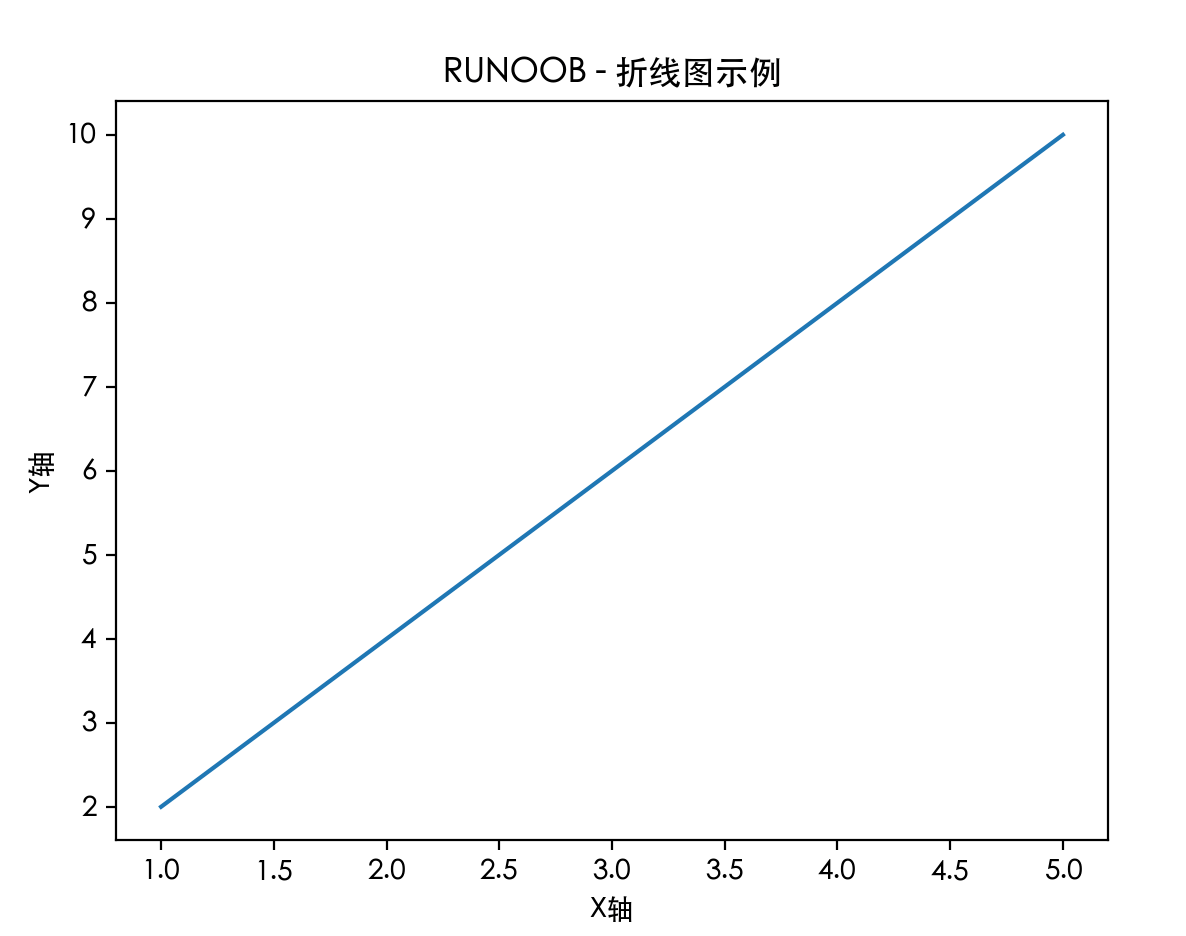
Then Chinese can be displayed normally, as shown below:
Universal method for various platform systems:
# -------------------------- 设置中文字体 start --------------------------
plt.rcParams['font.sans-serif'] = [
    # Windows 优先
    'SimHei', 'Microsoft YaHei',
    # macOS 优先
    'PingFang SC', 'Heiti TC',
    # Linux 优先
    'WenQuanYi Micro Hei', 'DejaVu Sans'
]
# 修复负号显示为方块的问题
plt.rcParams['axes.unicode_minus'] = False
# -------------------------- 设置中文字体 end --------------------------
Example
import matplotlib.pyplot as plt
# -------------------------- Set Chinese font start --------------------------
plt.rcParams['font.sans-serif'] = [
# Windows first
'SimHei', 'Microsoft YaHei',
# macOS first
'PingFang SC', 'Heiti TC',
# Linux first
'WenQuanYi Micro Hei', 'DejaVu Sans'
]
# Fix the issue of negative sign displaying as a square
plt.rcParams['axes.unicode_minus'] = False
# -------------------------- Set Chinese font end --------------------------
# Generate simulated data: add some random noise on top of the sine curve
np.random.seed(42)
X = np.linspace(0, 10, 20)
y_true = np.sin(X) # The true underlying pattern (which we don't know)
y_noise = np.random.randn(20) * 0.3 # Random noise
y = y_true + y_noise # The data we actually observe
plt.scatter(X, y, label='Observed data (with noise)', color='blue', alpha=0.6)
plt.plot(X, y_true, label='True pattern (y=sin(x))', color='green', linewidth=2)
plt.xlabel('X')
plt.ylabel('y')
plt.title('Data and underlying pattern')
plt.legend()
plt.grid(True)
plt.show()
Our goal is to find a curve (model) that best describes the pattern reflected by these blue scatter points (data).
The degree to which the model describes the data is calledfitting。
Using a font library
Matplotlib does not support Chinese by default. We can use the following simple method to solve this.
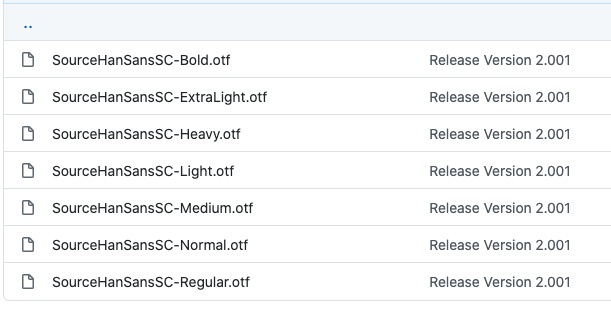
Here we use Source Han Sans, an open-source font launched by Adobe and Google.
Official website:https://source.typekit.com/source-han-serif/cn/
GitHub address:https://github.com/adobe-fonts/source-han-sans/tree/release/OTF/SimplifiedChinese
After opening the link, just pick one inside:
You can also download from the cloud drive:https://pan.baidu.com/s/10-w1JbXZSnx3Tm6uGpPGOw, extraction code:yxqu。
You can download an OTF font, such as SourceHanSansSC-Bold.otf, and place the file in the same directory as the currently executing code file:
Place the SourceHanSansSC-Bold.otf file in the same directory as the currently executing code file:
Example
The output after execution is as shown below: