Matplotlib Bar Chart
We can use the bar() method in pyplot to draw bar charts.
The syntax of the bar() method is as follows:
matplotlib.pyplot.bar(x, height, width=0.8, bottom=None, *, align='center', data=None, **kwargs)
Parameter description:
x: Floating-point array, the x-axis data of the bar chart.
height: Floating-point array, the height of the bar chart.
width: Floating-point array, the width of the bar chart.
bottom: Floating-point array, the y-coordinate of the base, default 0.
align: The alignment of the bar chart with the x-coordinate. 'center' centers the bar at the x position, which is the default value. 'edge': Aligns the left edge of the bar with the x position. To align bars to the right edge, you can pass a negative width value and align='edge'.
**kwargs:: Other parameters.
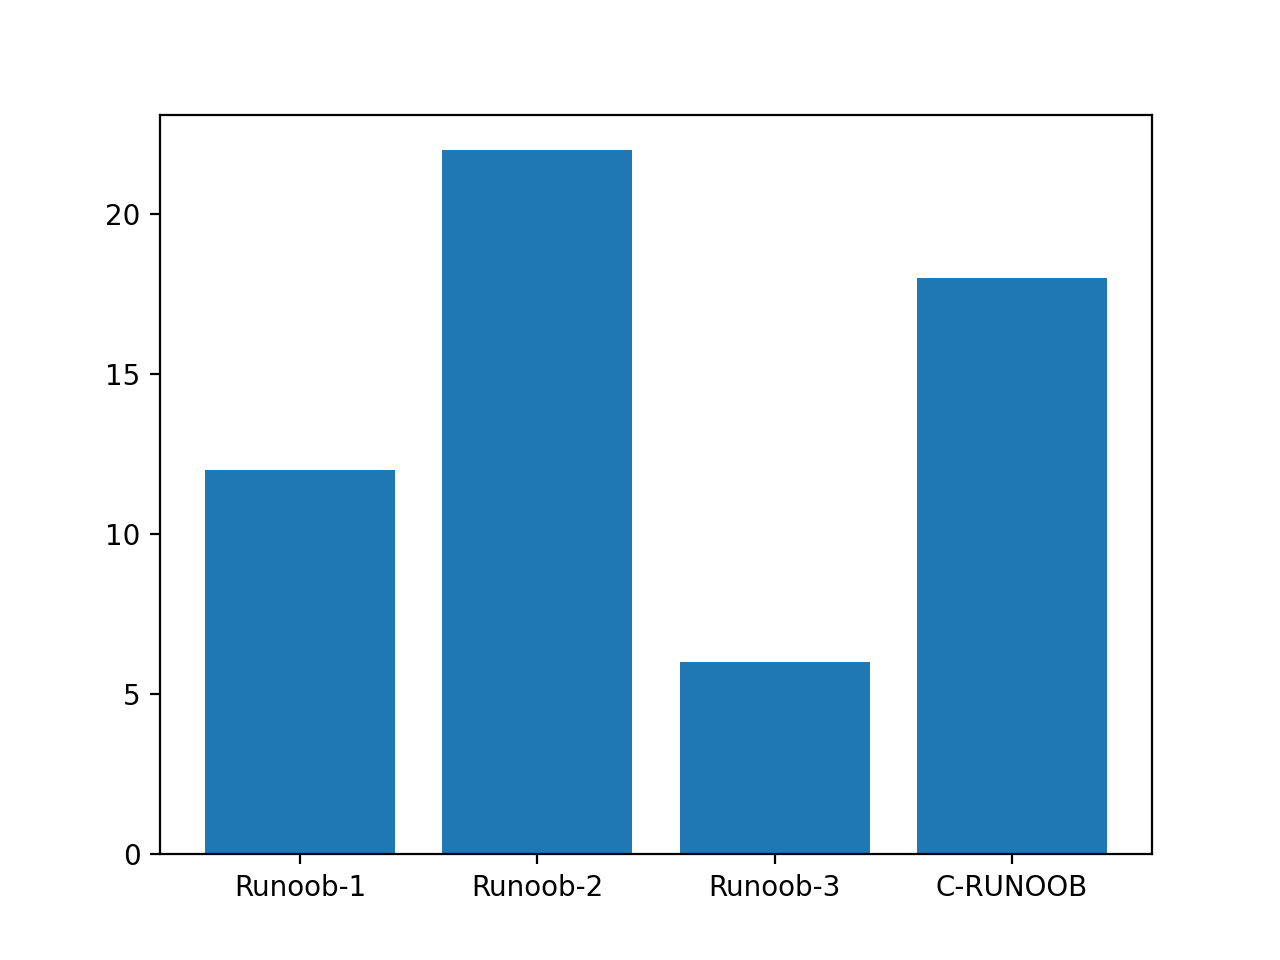
In the following example, we simply use bar() to create a bar chart:
Example
import numpy as np
x = np.array(["Example-1", "Example-2", "Example-3", "C-EXAMPLE"])
y = np.array([12, 22, 6, 18])
plt.bar(x,y)
plt.show()
The displayed result is as follows:
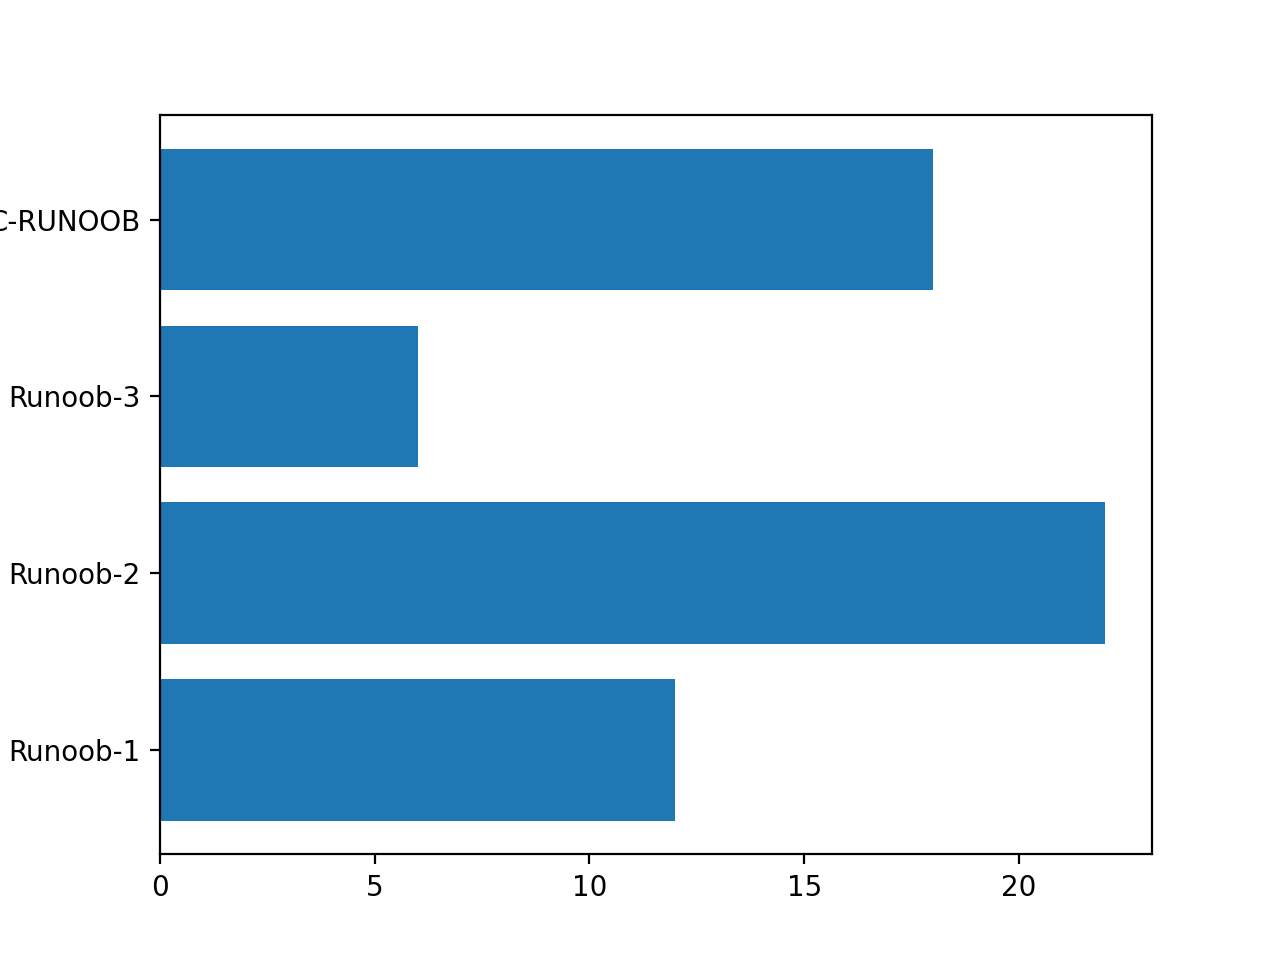
Vertical bar charts can use thebarh()method to set:
Example
import numpy as np
x = np.array(["Example-1", "Example-2", "Example-3", "C-EXAMPLE"])
y = np.array([12, 22, 6, 18])
plt.barh(x,y)
plt.show()
The displayed result is as follows:
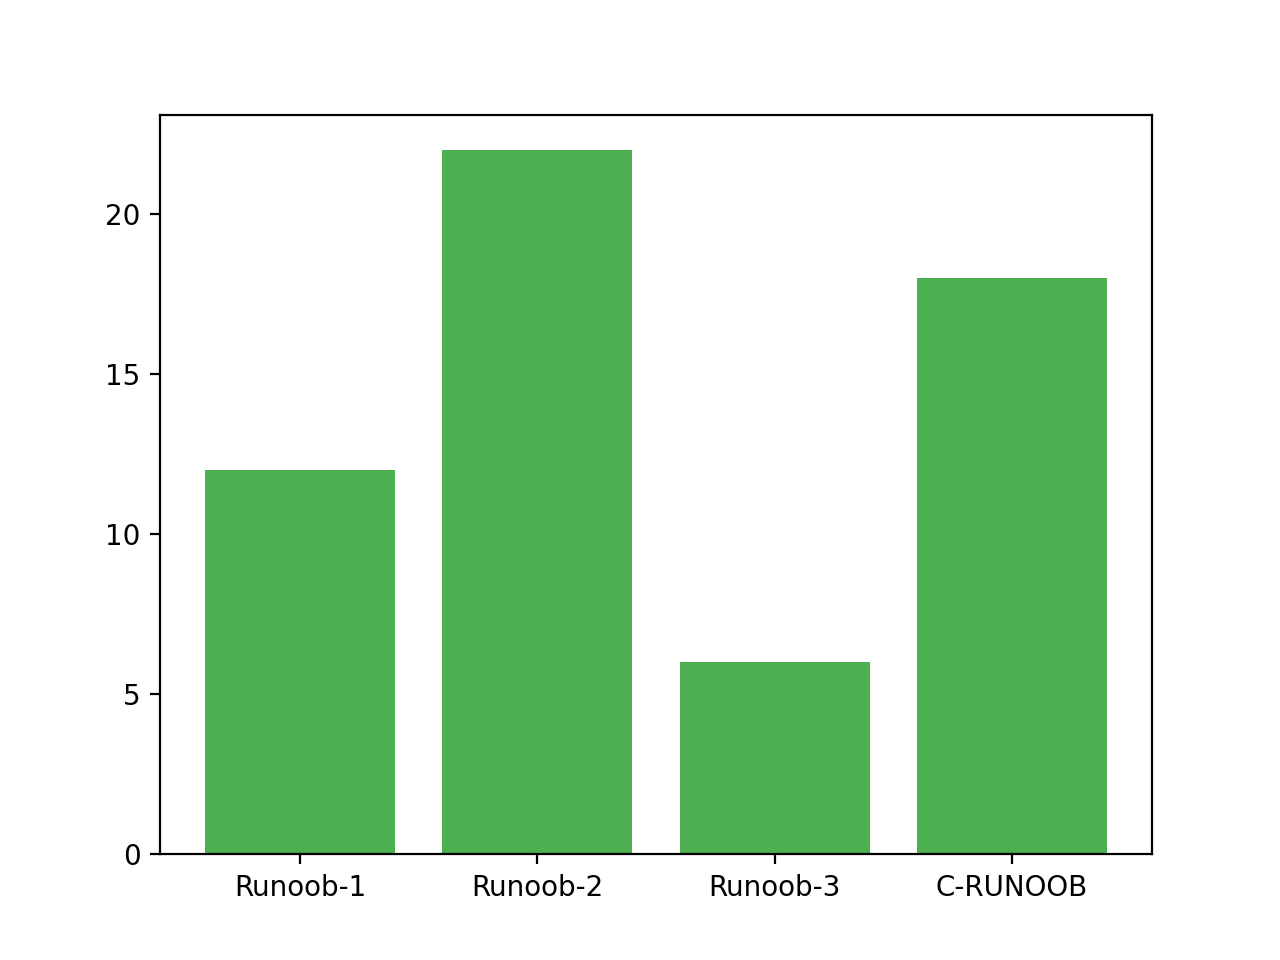
Set the bar chart color:
Example
import numpy as np
x = np.array(["Example-1", "Example-2", "Example-3", "C-EXAMPLE"])
y = np.array([12, 22, 6, 18])
plt.bar(x, y, color = "#4C7EAF")
plt.show()
The displayed result is as follows:
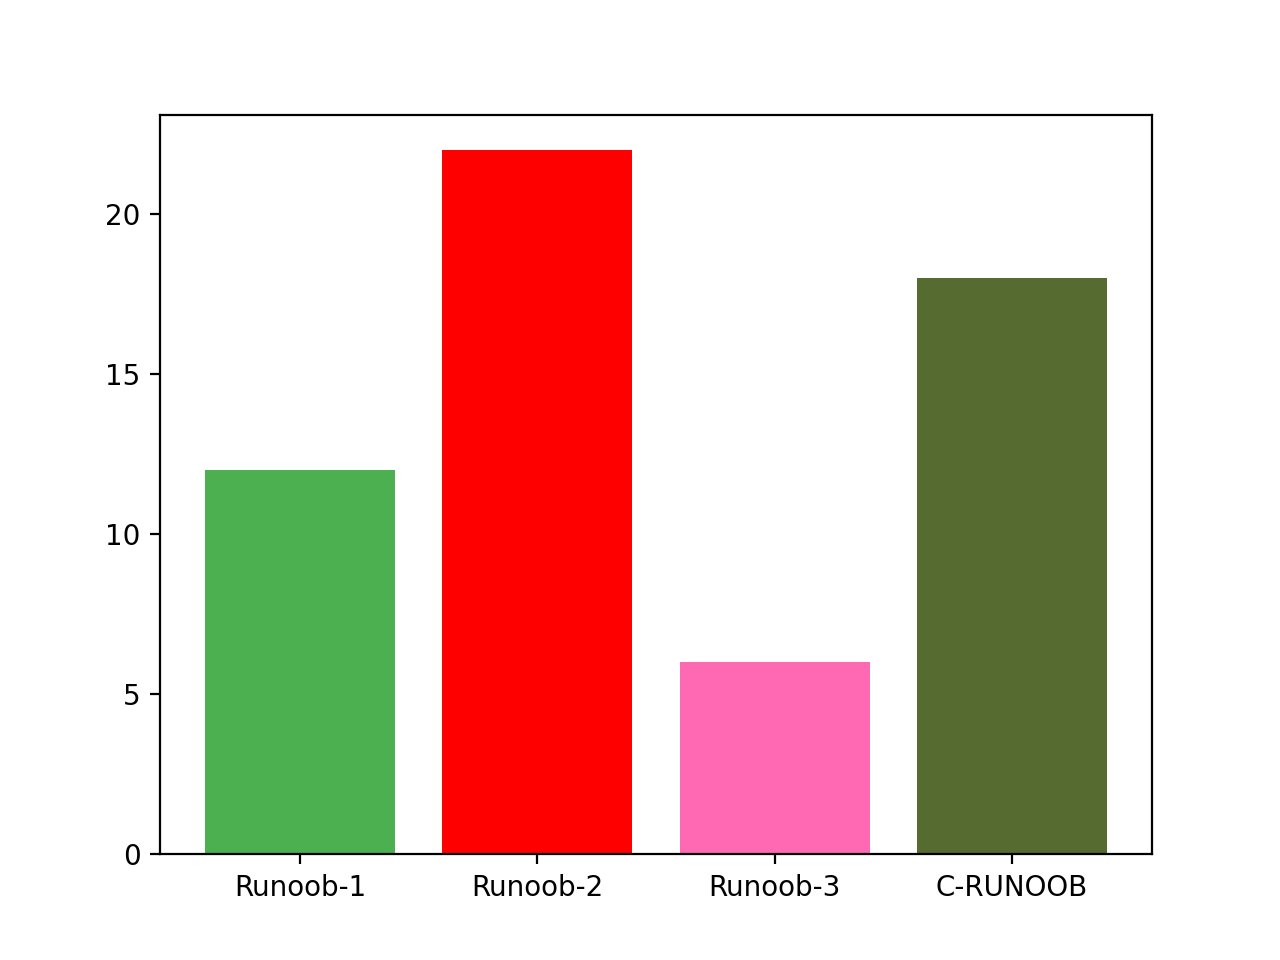
Customize the color of each bar:
Example
import numpy as np
x = np.array(["Example-1", "Example-2", "Example-3", "C-EXAMPLE"])
y = np.array([12, 22, 6, 18])
plt.bar(x, y, color = ["#4C7EAF","red","hotpink","#4977A6"])
plt.show()
The displayed result is as follows:
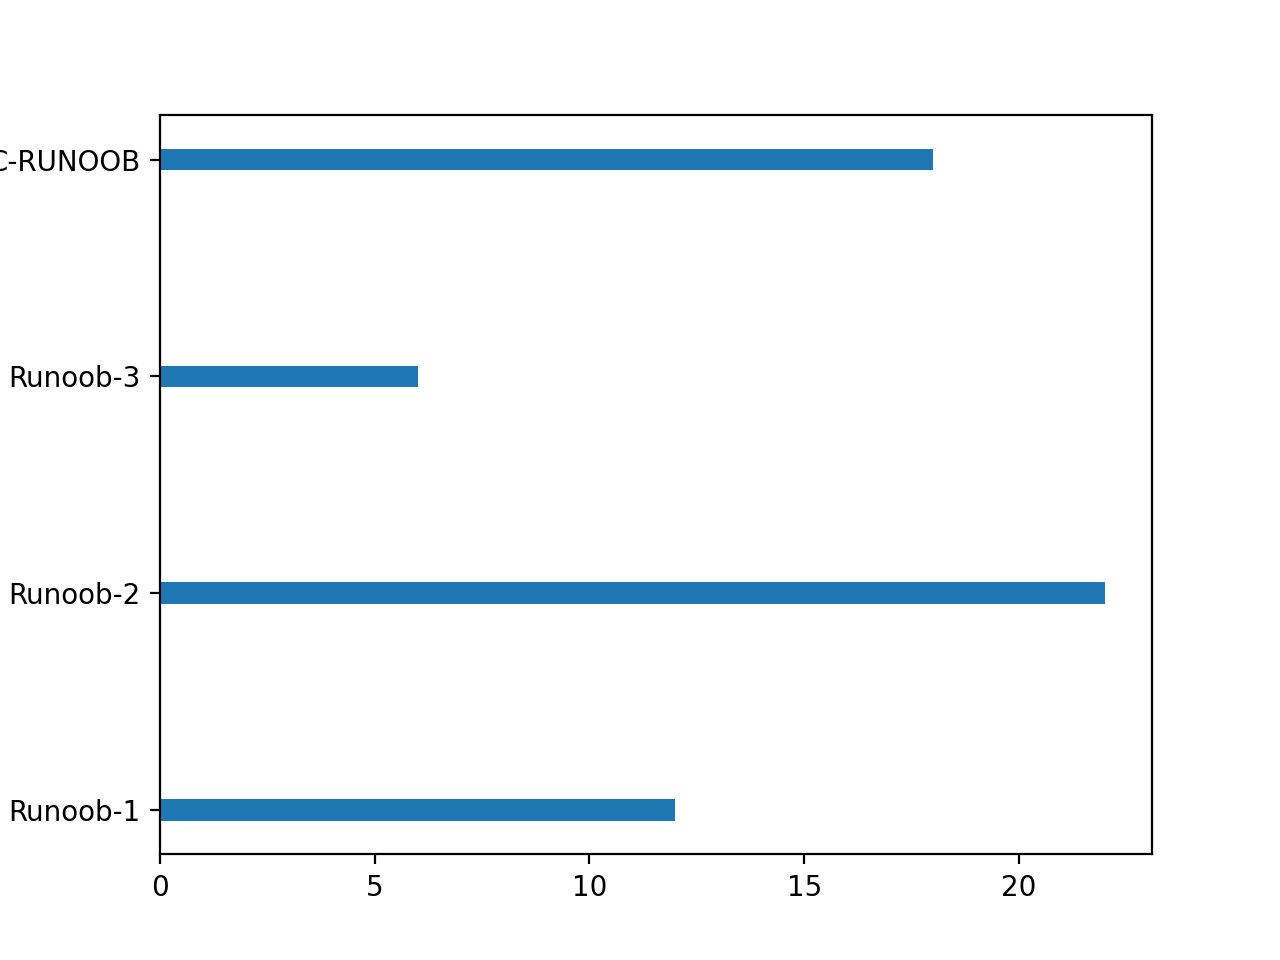
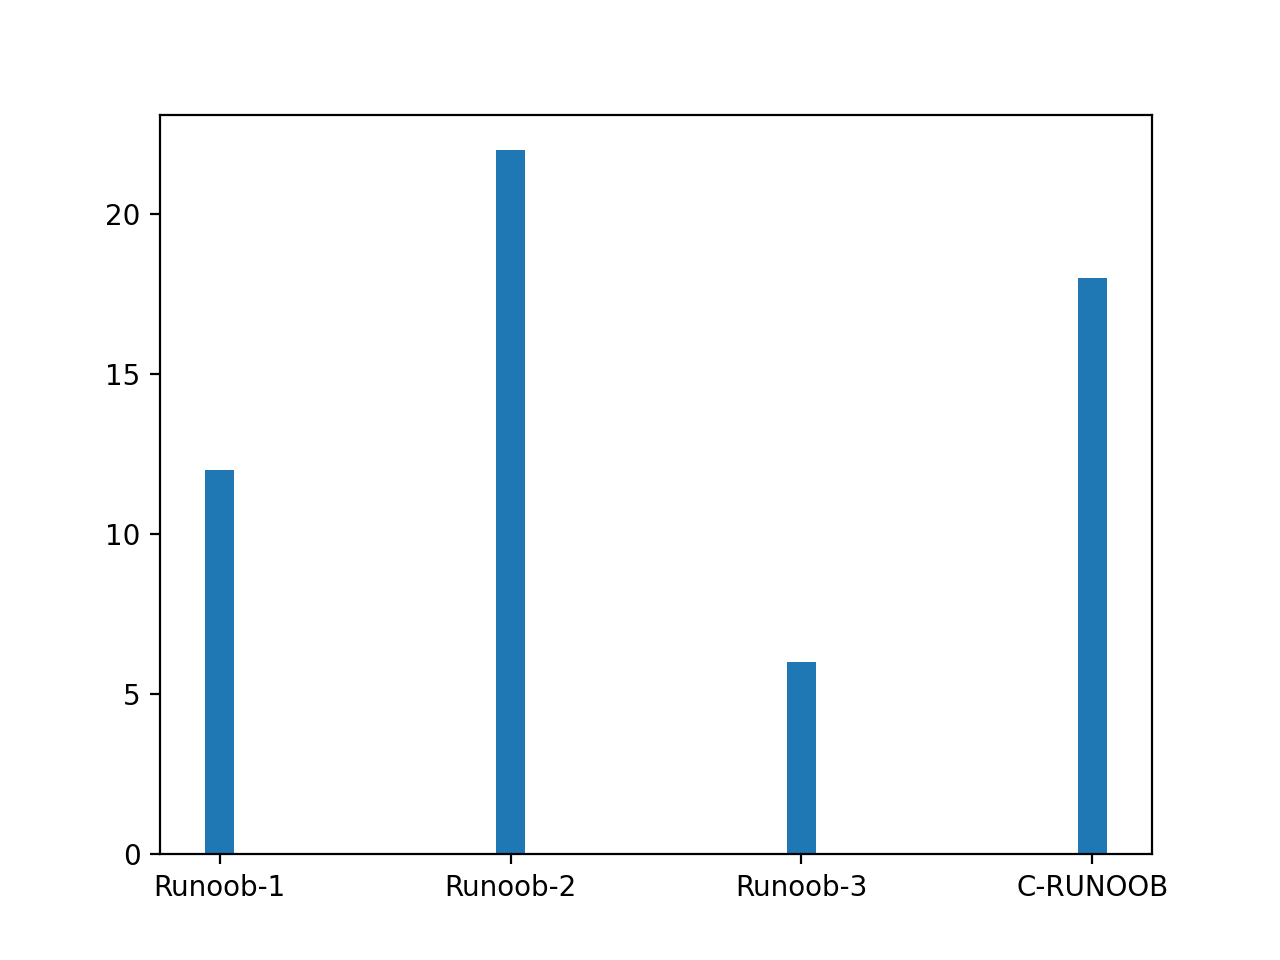
Set the bar chart width,bar()use the methodwidthto set,barh()use the methodheightset height
Example
import numpy as np
x = np.array(["Example-1", "Example-2", "Example-3", "C-EXAMPLE"])
y = np.array([12, 22, 6, 18])
plt.bar(x, y, width = 0.1)
plt.show()
The displayed result is as follows:
Example
import numpy as np
x = np.array(["Example-1", "Example-2", "Example-3", "C-EXAMPLE"])
y = np.array([12, 22, 6, 18])
plt.barh(x, y, height = 0.1)
plt.show()
The displayed result is as follows: