Matplotlib imshow() Method
The imshow() function is a function in the Matplotlib library, used to display images.
The imshow() function is often used to plot two-dimensional grayscale images or color images.
The imshow() function can be used to plot matrices, heatmaps, maps, etc.
The syntax of the imshow() method is as follows:
imshow(X, cmap=None, norm=None, aspect=None, interpolation=None, alpha=None, vmin=None, vmax=None, origin=None, extent=None, shape=None, filternorm=1, filterrad=4.0, imlim=None, resample=None, url=None, *, data=None, **kwargs)
Parameter description:
X: Input data. It can be a two-dimensional array, a three-dimensional array, a PIL image object, a matplotlib path object, etc.cmap: Color map. Used to control the colors corresponding to different values in the image. You can choose a built-in color map, such asgray、hot、jetetc., or you can also customize a color map.norm: Used to control the normalization method of values. You can chooseNormalize、LogNormand other normalization methods.aspect: Controls the aspect ratio of the image. Can be set toautoor a number.interpolation: Interpolation method. Used to control the smoothness and detail level of the image. You can choosenearest、bilinear、bicubicand other interpolation methods.alpha: Image transparency. The value range is 0~1.origin: The position of the axes origin. Can be set toupperorlower。extent: Controls the data range to be displayed. Can be set to[xmin, xmax, ymin, ymax]。vmin、vmax: Controls the value range of the color map.filternorm 和 filterrad: The object used for image filtering. Can be set toNone、antigrain、freetypeetc.imlim: Used to specify the display range of the image.resample: Used to specify the image resampling method.url: Used to specify the image link.
Below are some examples of using the imshow() function.
Display Grayscale Image
Example
import numpy as np
# Generate a two-dimensional random array
img = np.random.rand(10, 10)
# Plot the grayscale image
plt.imshow(img, cmap='gray')
# Display the image
plt.show()
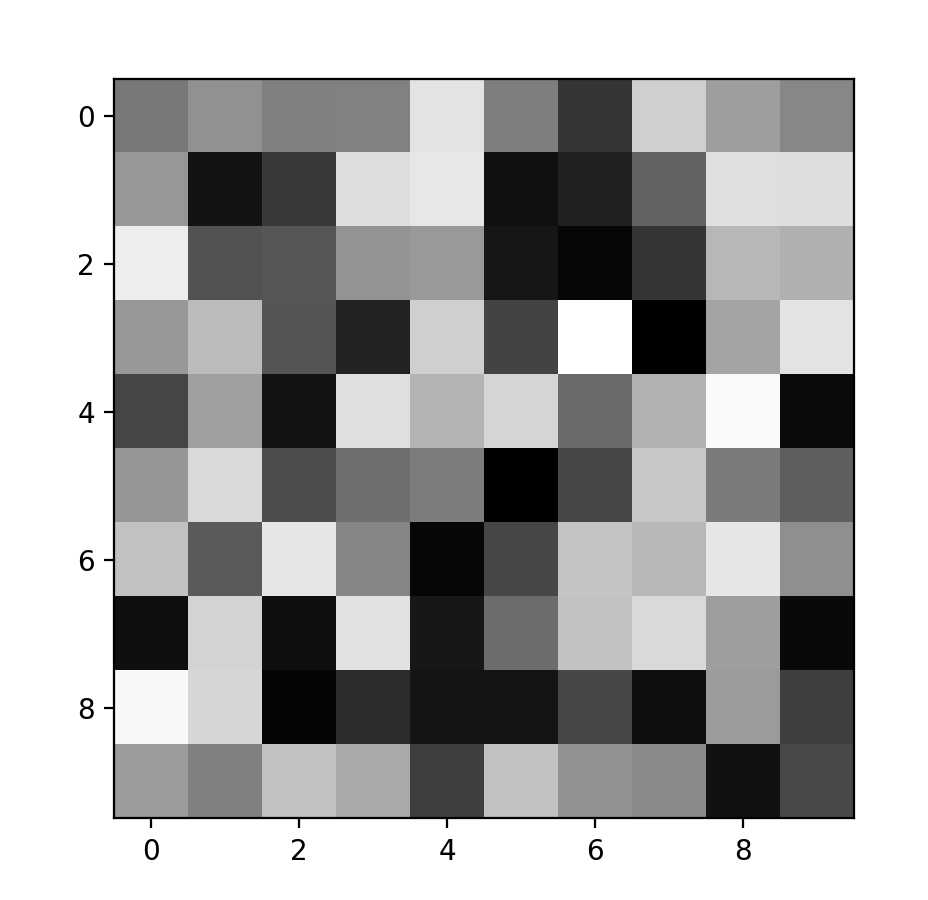
In the above example, we generated a 10x10 random array and used the imshow() function to display it as a grayscale image.
We set the cmap parameter to gray, which means the image will be displayed using a grayscale color map.
The display result is as follows:
Display Color Image
Example
import numpy as np
# Generate a random color image
img = np.random.rand(10, 10, 3)
# Plot the color image
plt.imshow(img)
# Display the image
plt.show()
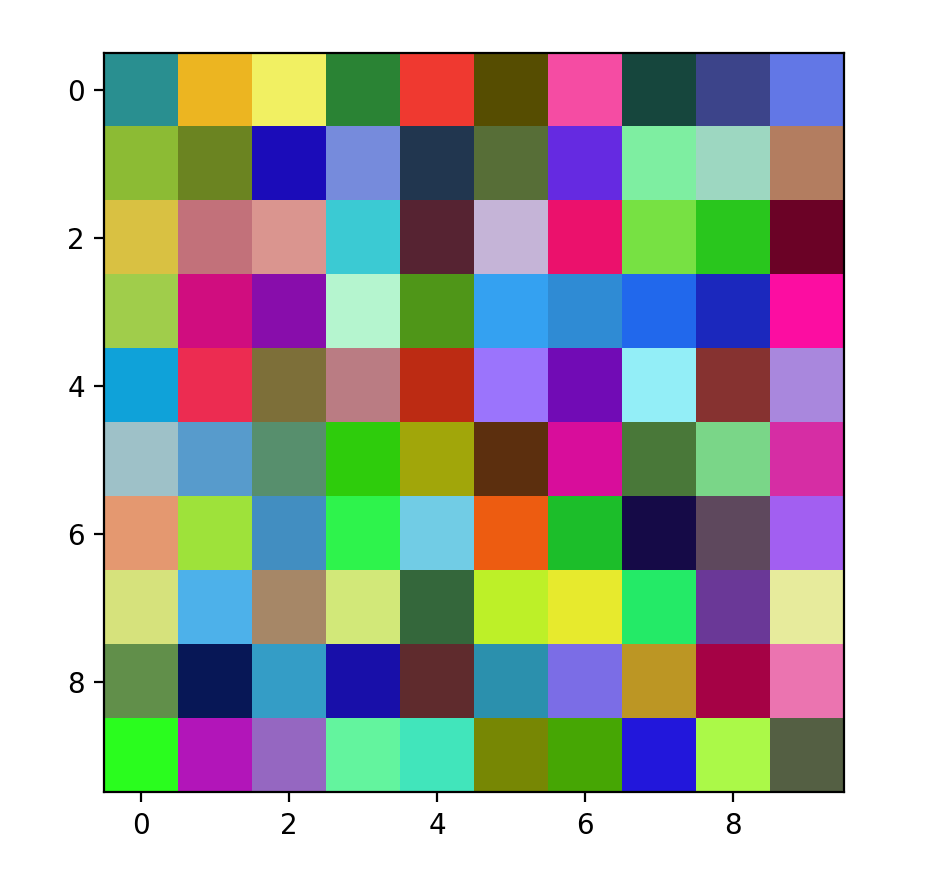
In the above example, we generated a 10x10 random color image and used the imshow() function to display it.
Since a color image is a three-dimensional array, there is no need to set the cmap parameter.
The display result is as follows:
Display Heatmap
Example
import numpy as np
# Generate a two-dimensional random array
data = np.random.rand(10, 10)
# Plot the heatmap
plt.imshow(data, cmap='hot')
# Display the image
plt.colorbar()
plt.show()
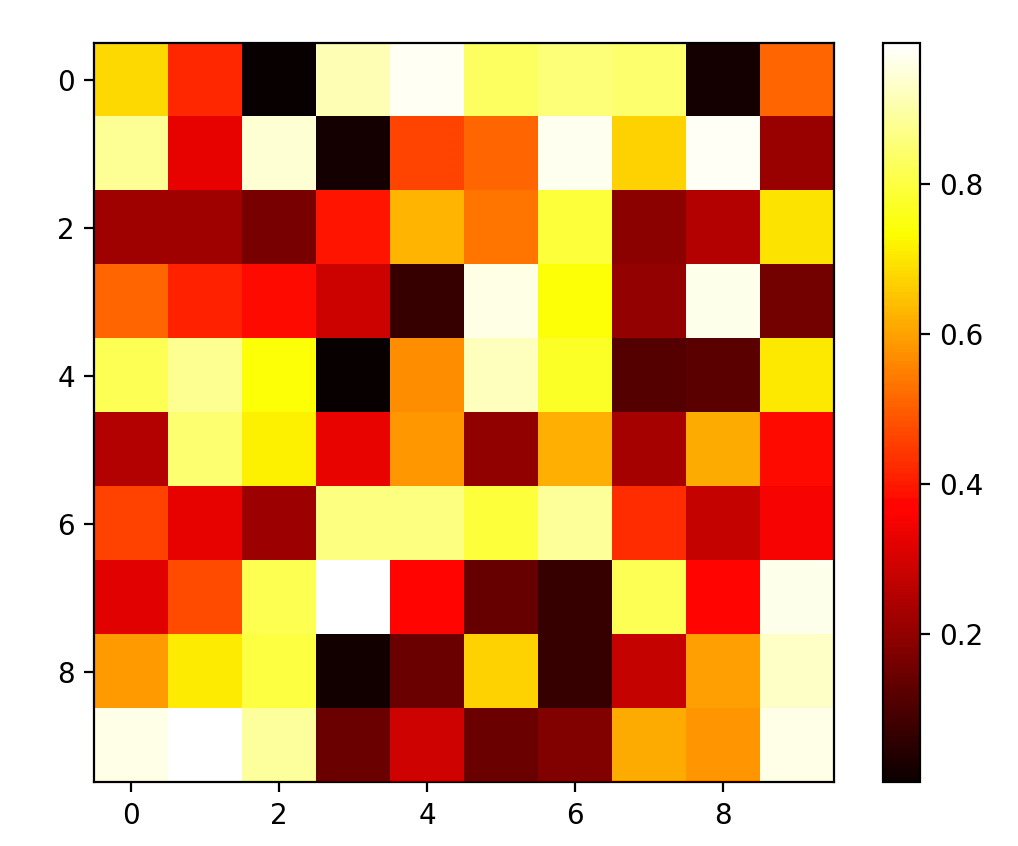
In the above example, we generated a 10x10 random array and used the imshow() function to display it as a heatmap.
We set the cmap parameter to hot, which means the image will be displayed using a heat color map.
In addition, we also added a colorbar so as to view the relationship between data values and colors.
The display result is as follows:
Display Map
Example
import numpy as np
from PIL import Image
# Load the map image, download URL: https://static.jyshare.com/images/demo/map.jpeg
img = Image.open('map.jpg')
# Convert to an array
data = np.array(img)
# Plot the map
plt.imshow(data)
# Hide the axes
plt.axis('off')
# Display the image
plt.show()
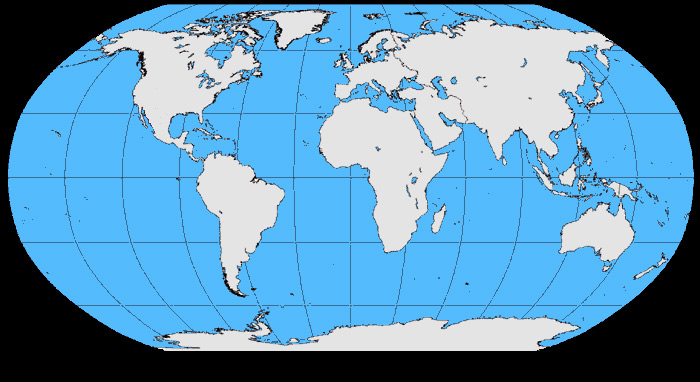
In the above example, we loaded a map image and converted it into an array.
Then, we used the imshow() function to display it, and used theaxis('off')function to hide the axes, so as to view the map better.
The display result is as follows:
Display Matrix
Example
import numpy as np
# Generate a random matrix
data = np.random.rand(10, 10)
# Plot the matrix
plt.imshow(data)
# Display the image
plt.show()
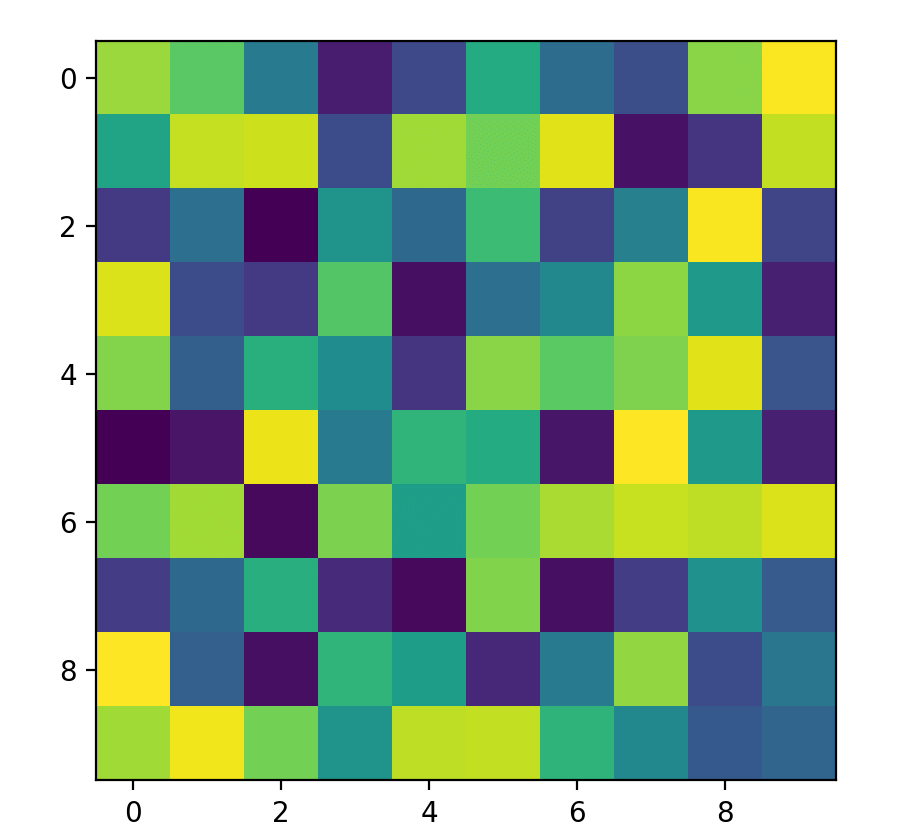
In the above example, we generated a random matrix and used the imshow() function to display it as an image.
Since a matrix is also a two-dimensional array, the imshow() function can be used to display it.
The display result is as follows:
More Examples
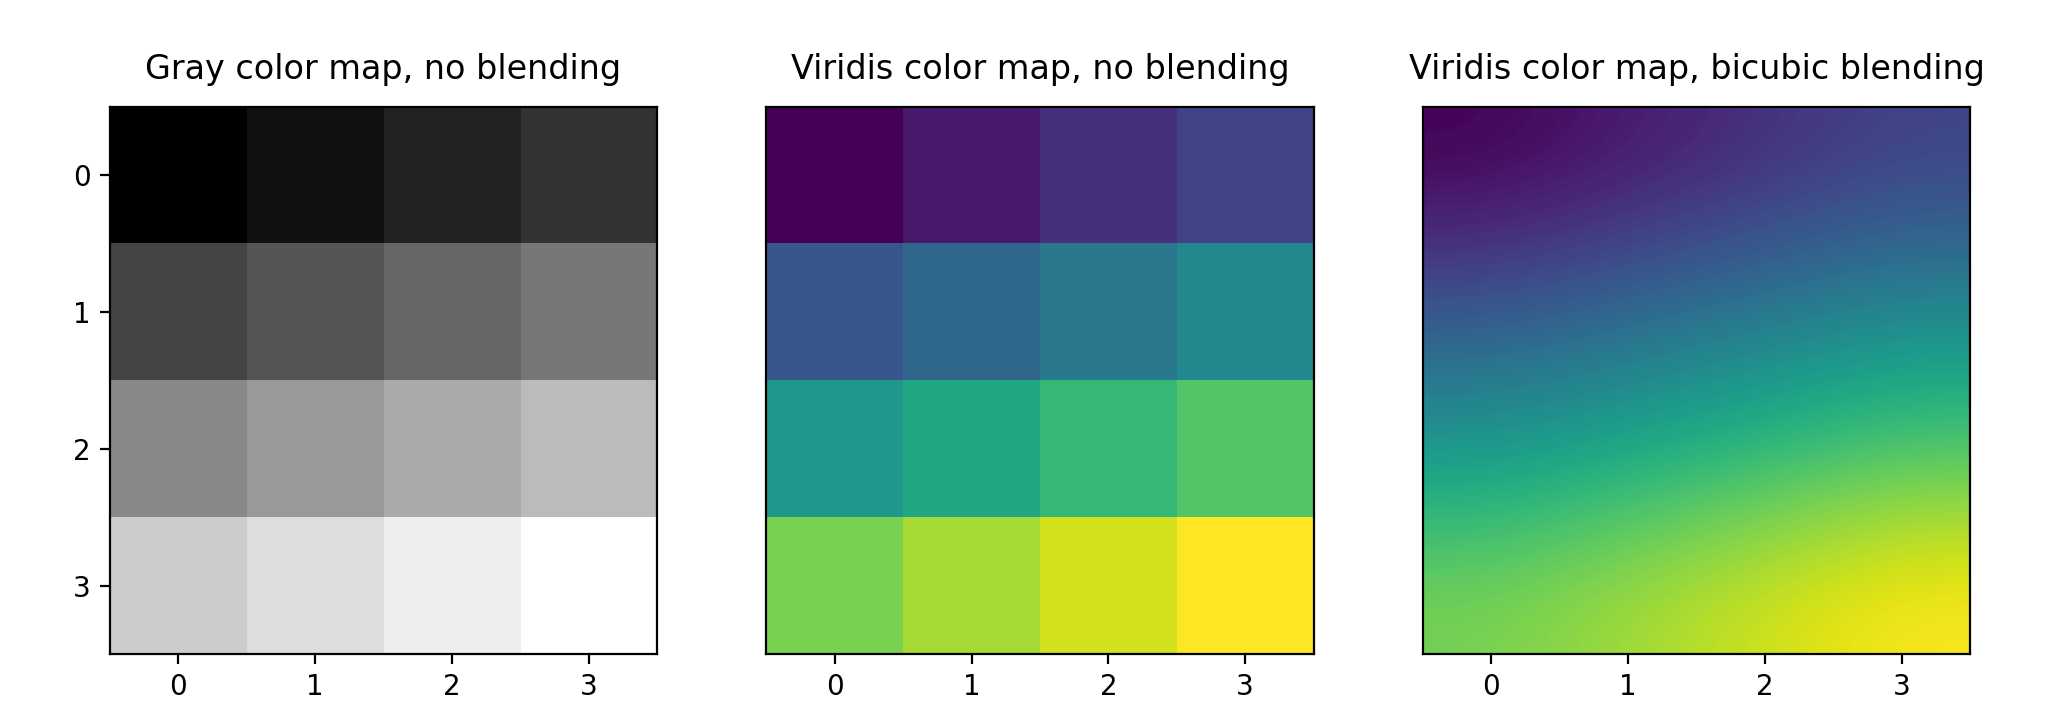
The following creates a 4x4 two-dimensional numpy array and performs three different imshow image displays on it.
- The first one shows the grayscale color mapping method, without performing color blending.
- The second one shows an image using the viridis color map, also without performing color blending.
- The third one shows an image using the viridis color map, and uses the bicubic interpolation method for color blending.
Example
import numpy as np
n = 4
# Create an n x n two-dimensional numpy array
a = np.reshape(np.linspace(0,1,n**2), (n,n))
plt.figure(figsize=(12,4.5))
# The first image shows the grayscale color mapping method, without performing color blending
plt.subplot(131)
plt.imshow(a, cmap='gray', interpolation='nearest')
plt.xticks(range(n))
plt.yticks(range(n))
# Grayscale mapping, no blending
plt.title('Gray color map, no blending', y=1.02, fontsize=12)
# The second image shows an image using the viridis color map, also without performing color blending
plt.subplot(132)
plt.imshow(a, cmap='viridis', interpolation='nearest')
plt.yticks([])
plt.xticks(range(n))
# Viridis mapping, no blending
plt.title('Viridis color map, no blending', y=1.02, fontsize=12)
# The third image shows an image using the viridis color map, and uses the bicubic interpolation method for color blending
plt.subplot(133)
plt.imshow(a, cmap='viridis', interpolation='bicubic')
plt.yticks([])
plt.xticks(range(n))
# Viridis mapping, bicubic blending
plt.title('Viridis color map, bicubic blending', y=1.02, fontsize=12)
plt.show()
The display result is as follows: