Matplotlib imread() Method
The imread() method is a function in the Matplotlib library used to read image data from an image file.
The imread() method returns a numpy.ndarray object whose shape is(nrows, ncols, nchannels), indicating the number of rows, columns, and channels of the read image:
- If the image is a grayscale image, nchannels is 1.
- If it is a color image, nchannels is 3 or 4, representing the three color channels red, green, and blue, and an alpha channel, respectively.
The syntax of the imread() method is as follows:
matplotlib.pyplot.imread(fname, format=None)
Parameter description:
fname: Specifies the file name or file path of the image file to be read. It can be a relative path or an absolute path.format: The parameter specifies the format of the image file. If not specified, the format is automatically recognized based on the file extension by default.
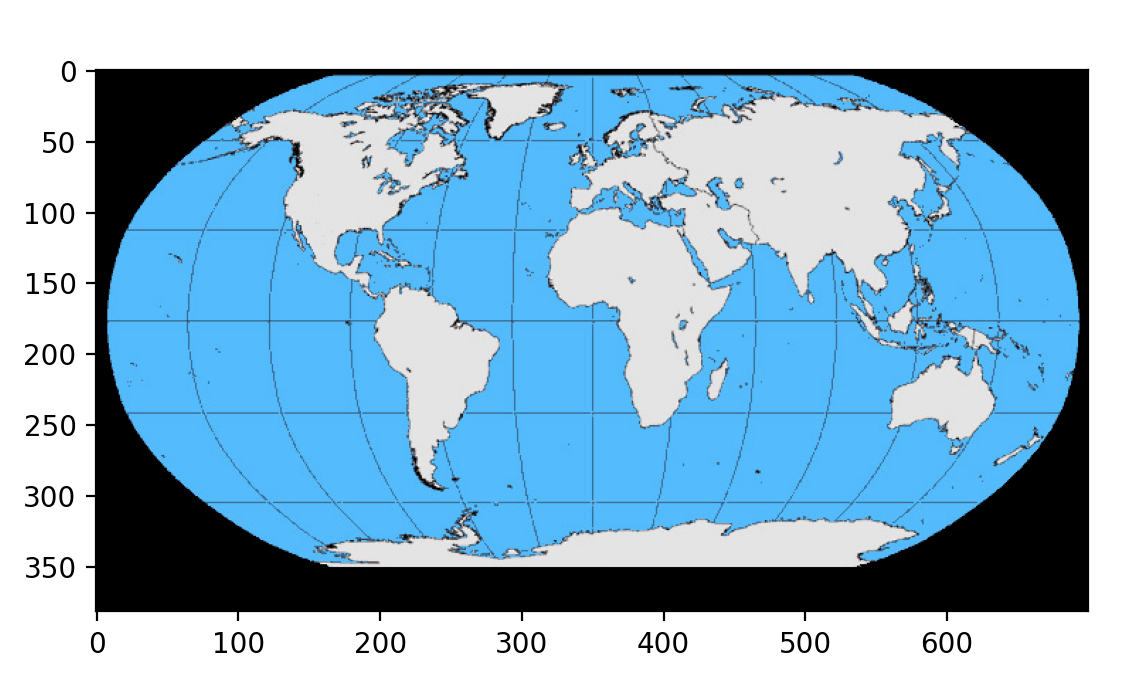
The following example demonstrates how to use the imread function to read image data from an image file and display it:
Example
# Read the image file, download address: https://static.jyshare.com/images/demo/map.jpeg
img = plt.imread('map.jpeg')
# Display the image
plt.imshow(img)
plt.show()
In the above example, we first use the imread() method to read image data from the image file named map.jpeg and store it in the img variable.
Then we use the imshow() method to display this image.
Note: We did not specify a color map when displaying the image, because the imread() method has already converted the image data to RGB format according to the correct color map, so we can directly use the default color map to display the image.
The display result is as follows:
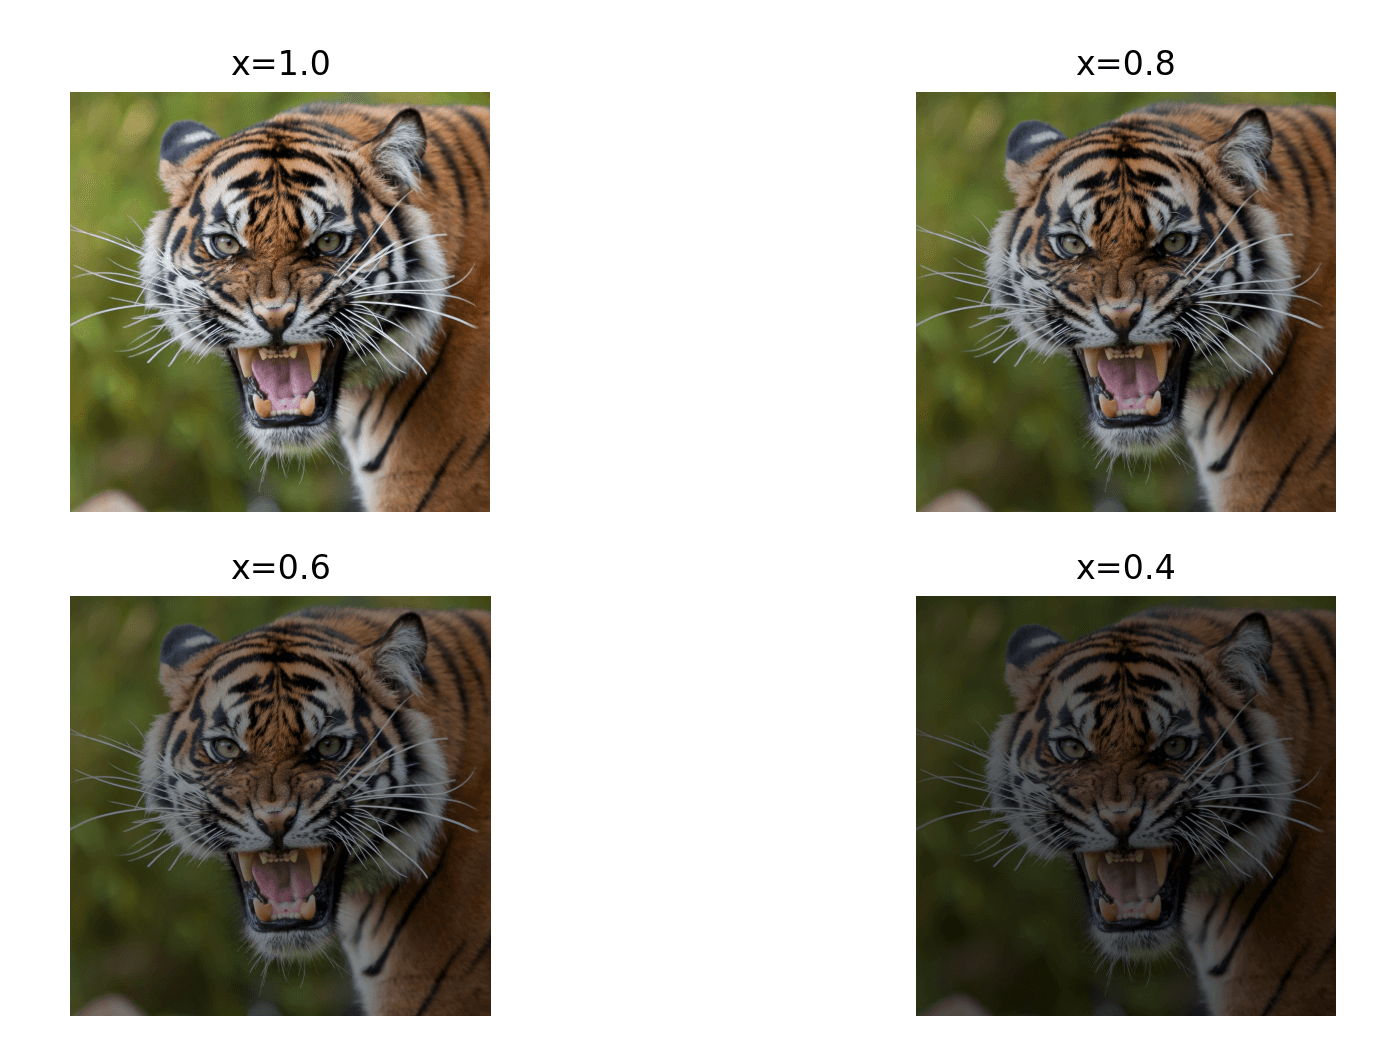
We can modify the image by changing the numpy array.
For example, if we multiply the array by a number0≤≤1, we darken the image:
Example
# Read the image file, download address: https://static.jyshare.com/images/mix/tiger.jpeg
img_array = plt.imread('tiger.jpeg')
tiger = img_array/255
#print(tiger)
# Display the image
plt.figure(figsize=(10,6))
for i in range(1,5):
plt.subplot(2,2,i)
x = 1 - 0.2*(i-1)
plt.axis('off') #hide coordinate axes
plt.title('x={:.1f}'.format(x))
plt.imshow(tiger*x)
plt.show()
The display result is as follows:
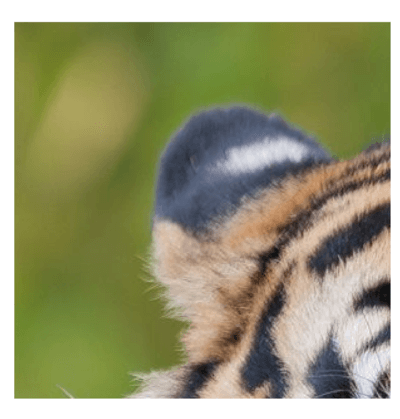
The following example is used to crop an image:
Example
# Read the image file, download address: https://static.jyshare.com/images/mix/tiger.jpeg
img_array = plt.imread('tiger.jpeg')
tiger = img_array/255
#print(tiger)
# Display the image
plt.figure(figsize=(6,6))
plt.imshow(tiger[:300,100:400,:])
plt.axis('off')
plt.show()
The display result is as follows:
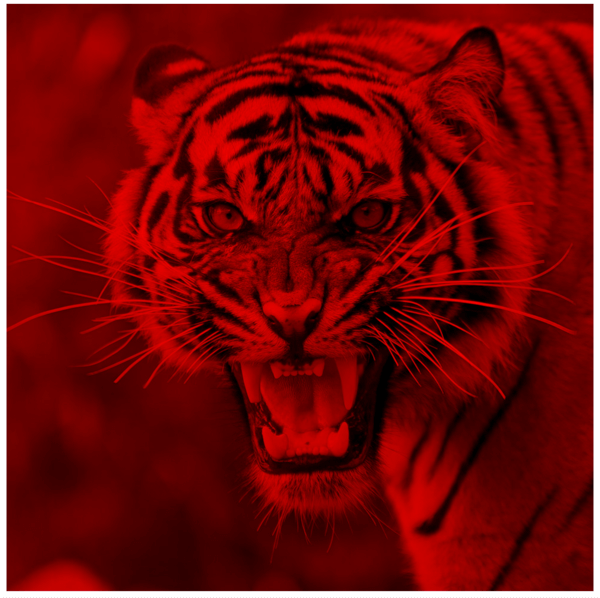
If we set the array elements of the green and blue coordinates of the RGB color to 0, we will get a red image:
Example
# Read the image file, download address: https://static.jyshare.com/images/mix/tiger.jpeg
img_array = plt.imread('tiger.jpeg')
tiger = img_array/255
#print(tiger)
# Display the image
red_tiger = tiger.copy()
red_tiger[:, :,[1,2]] = 0
plt.figure(figsize=(10,10))
plt.imshow(red_tiger)
plt.axis('off')
plt.show()
The display result is as follows: