Matplotlib Grid Lines
We can use the grid() method in pyplot to set grid lines in a chart.
The syntax of the grid() method is as follows:
matplotlib.pyplot.grid(b=None, which='major', axis='both', )
Parameter description:
- bOptional, default is None. Can be set to a boolean value: true shows grid lines, false does not show. If **kwargs parameters are set, the value is true.
- whichOptional. Optional values are 'major', 'minor', and 'both', default is 'major', indicating the grid lines to which the changes apply.
- axisOptional. Sets which direction of grid lines to display. It can be 'both' (default), 'x', or 'y', meaning both directions, the x-axis direction, or the y-axis direction respectively.
- **kwargsOptional. Sets grid line style. It can be color='r', linestyle='-', and linewidth=2, representing the color, style, and width of the grid lines respectively.
The following example adds a simple grid line using default parameter values:
Example
import matplotlib.pyplot as plt
x = np.array([1, 2, 3, 4])
y = np.array([1, 4, 9, 16])
plt.title("EXAMPLE grid() Test")
plt.xlabel("x - label")
plt.ylabel("y - label")
plt.plot(x, y)
plt.grid()
plt.show()
The displayed result is as follows:
The following example adds a simple grid line. The axis parameter uses x to display grid lines along the x-axis direction:
Example
import matplotlib.pyplot as plt
x = np.array([1, 2, 3, 4])
y = np.array([1, 4, 9, 16])
plt.title("EXAMPLE grid() Test")
plt.xlabel("x - label")
plt.ylabel("y - label")
plt.plot(x, y)
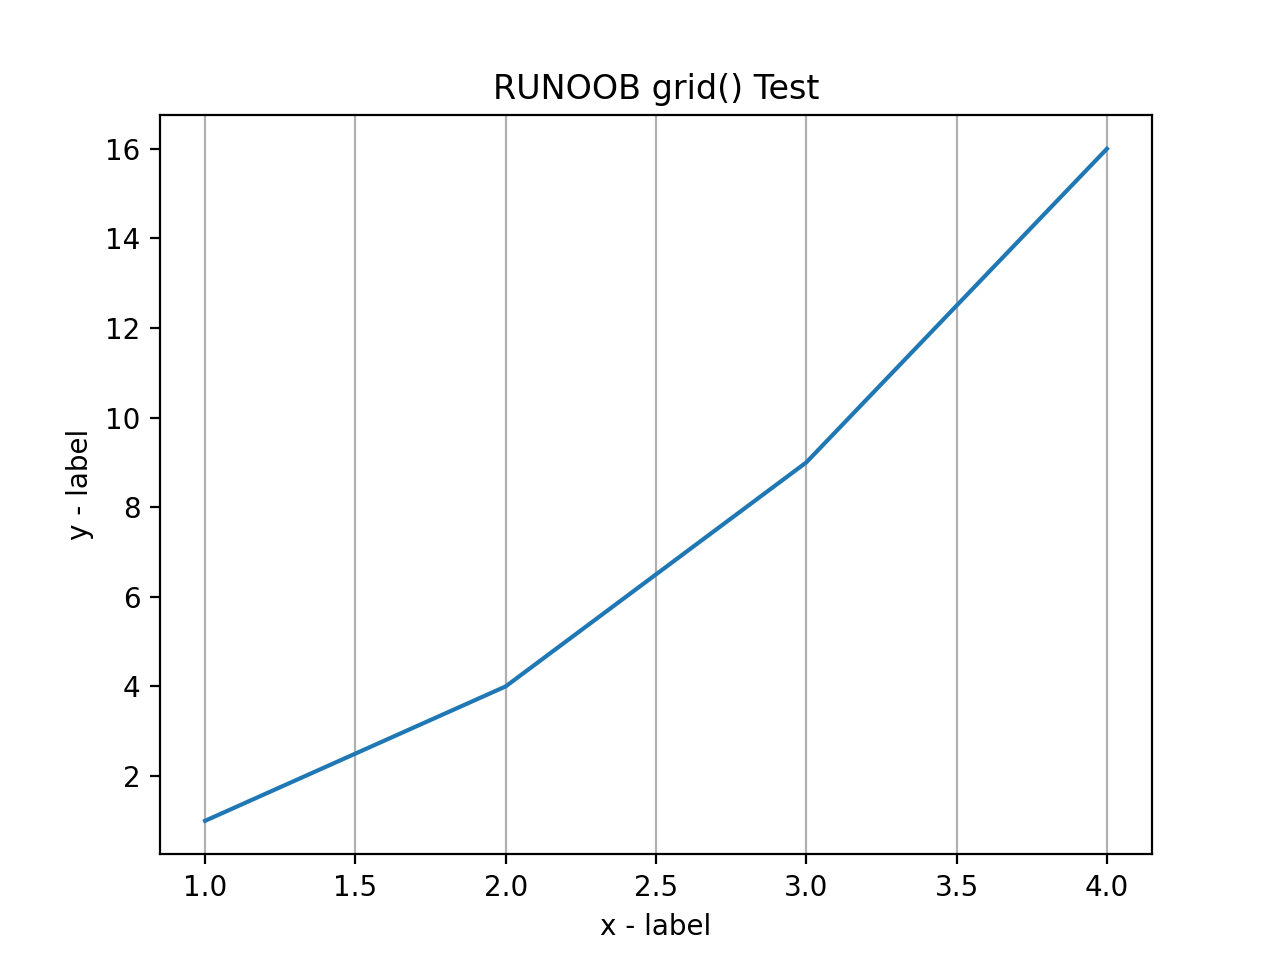
plt.grid(axis='x') # Set y to display grid lines along the axis direction
plt.show()
The displayed result is as follows:
The following example adds a simple grid line and sets the grid line style, as shown below:
grid(color = 'color', linestyle = 'linestyle', linewidth = number)
Parameter description:
color:'b' blue, 'm' magenta, 'g' green, 'y' yellow, 'r' red, 'k' black, 'w' white, 'c' cyan, '#0053A6' RGB color string.
linestyle:'-' solid line, '--' dashed line, '-.' dash-dot line, ':' dotted line.
linewidthOptional. Sets the line width; can be set to a number.
Example
import matplotlib.pyplot as plt
x = np.array([1, 2, 3, 4])
y = np.array([1, 4, 9, 16])
plt.title("EXAMPLE grid() Test")
plt.xlabel("x - label")
plt.ylabel("y - label")
plt.plot(x, y)
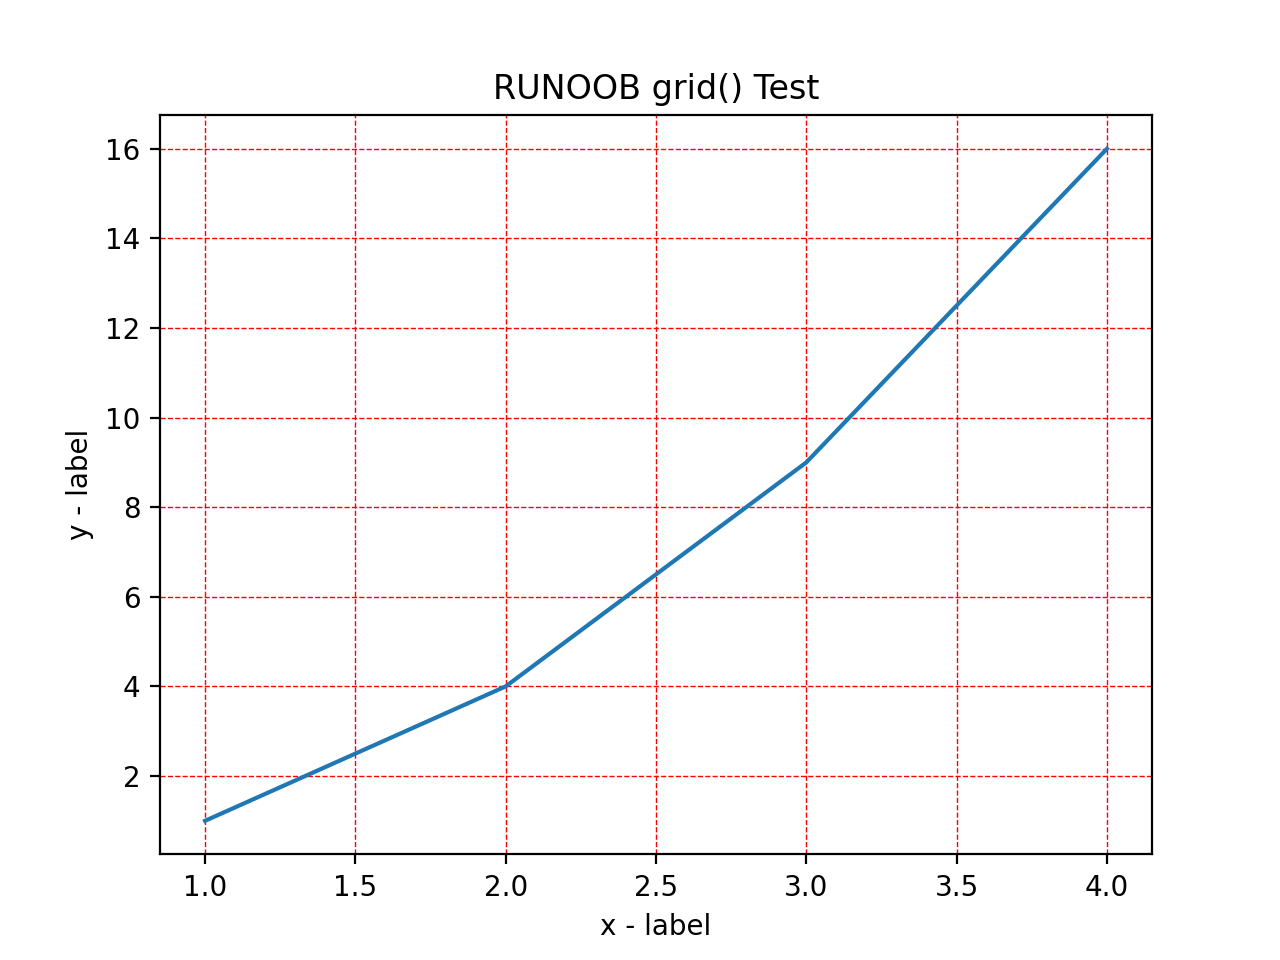
plt.grid(color = 'r', linestyle = '--', linewidth = 0.5)
plt.show()
The displayed result is as follows: