Matplotlib Plotting Lines
In the plotting process, we can customize the line style, including line type, color, and size, etc.
Line Types
The line type can be set using thelinestyleparameter, abbreviated asls。
| Type | Shorthand | Description |
|---|---|---|
| 'solid' (default) | '-' | Solid line |
| 'dotted' | ':' | Dotted line |
| 'dashed' | '--' | Dashed line |
| 'dashdot' | '-.' | Dash-dot line |
| 'None' | '' or ' ' | No line |
Example
import numpy as np
ypoints = np.array([6, 2, 13, 10])
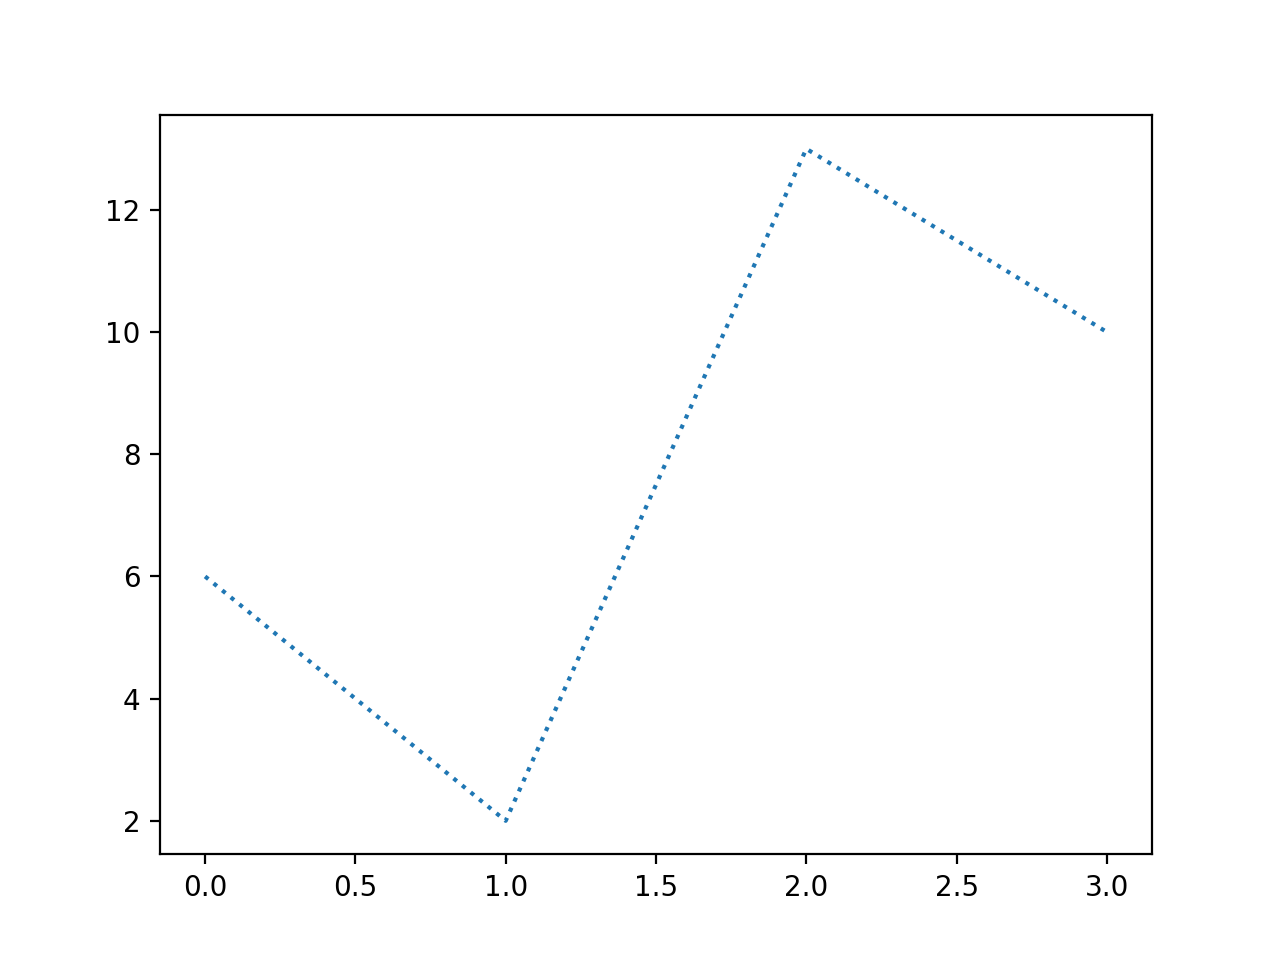
plt.plot(ypoints, linestyle = 'dotted')
plt.show()
The display result is as follows:
Using the shorthand:
Example
import numpy as np
ypoints = np.array([6, 2, 13, 10])
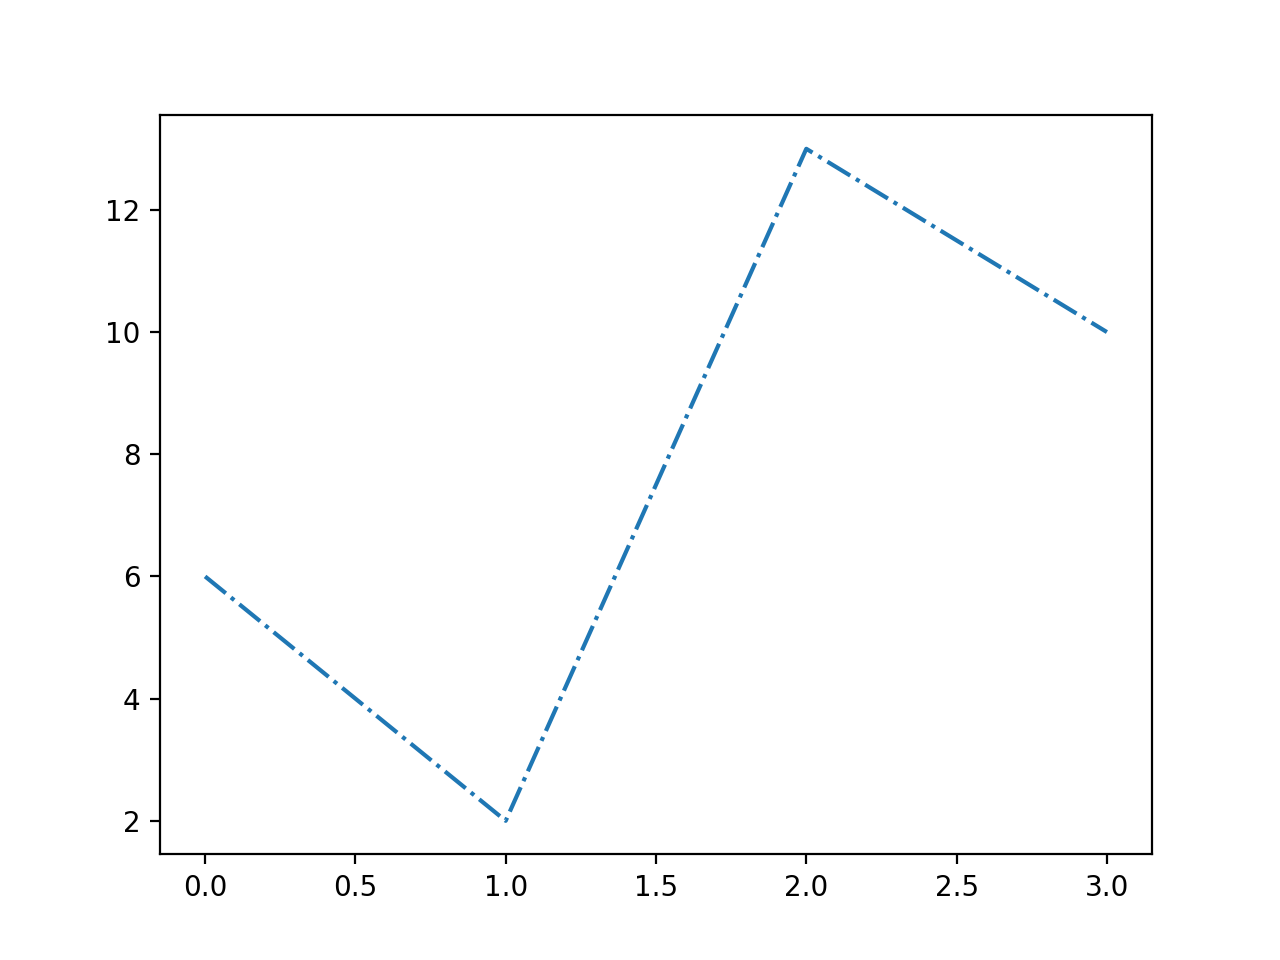
plt.plot(ypoints, ls = '-.')
plt.show()
The display result is as follows:
Line Colors
The line color can be set using thecolorparameter, abbreviated asc。
Color types:
| Color code | Description | |
|---|---|---|
| 'r' | Red | |
| 'g' | Green | |
| 'b' | Blue | |
| 'c' | Cyan | |
| 'm' | Magenta | |
| 'y' | Yellow | |
| 'k' | Black | |
| 'w' | White | |
Of course, you can also customize color types, for example:SeaGreen、#8FA6BCetc. For the full styles, refer toHTML color values。
Example
import numpy as np
ypoints = np.array([6, 2, 13, 10])
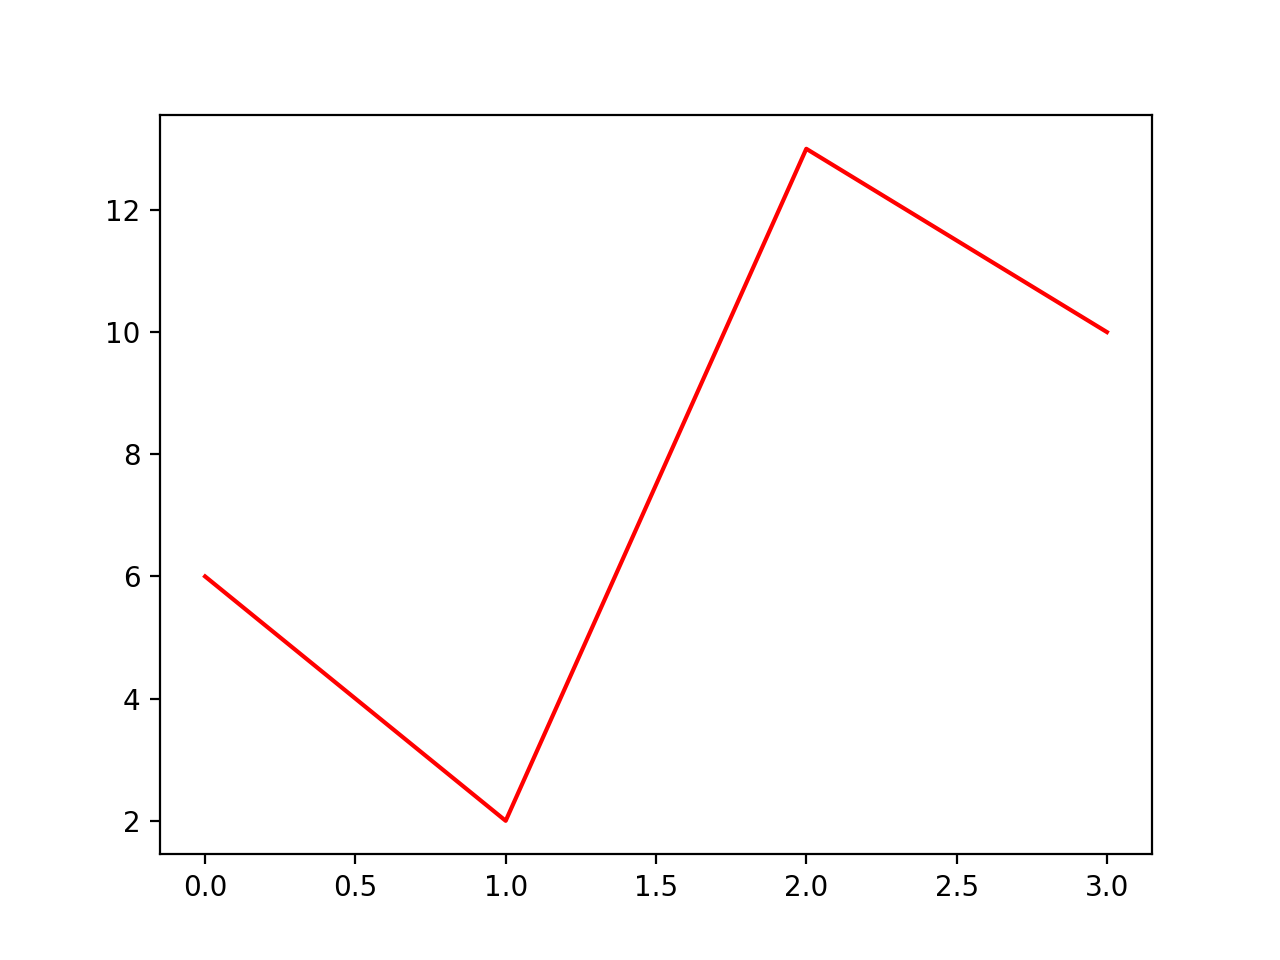
plt.plot(ypoints, color = 'r')
plt.show()
The display result is as follows:
Example
import numpy as np
ypoints = np.array([6, 2, 13, 10])
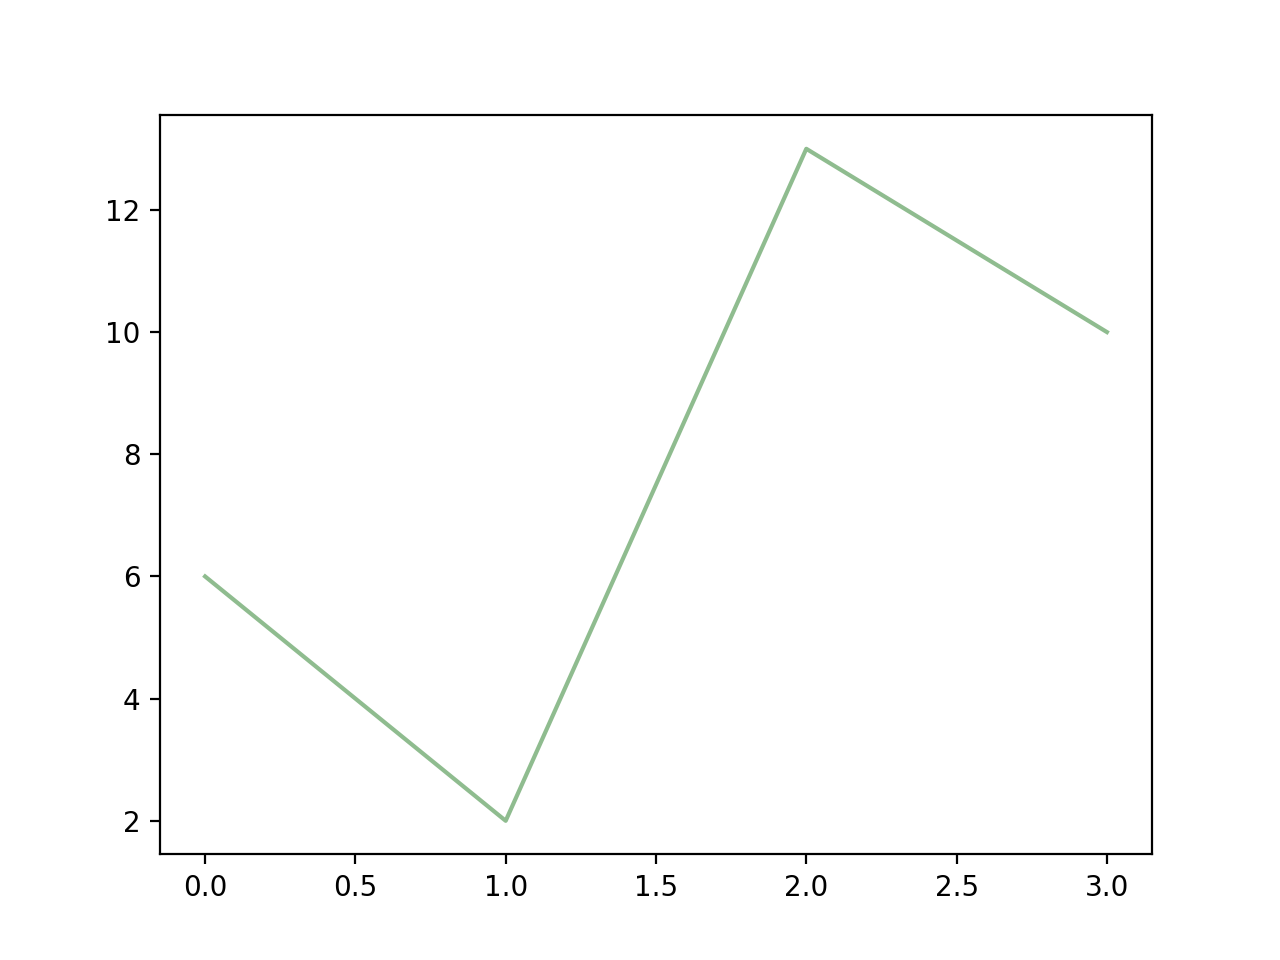
plt.plot(ypoints, c = '#8FA6BC')
plt.show()
The display result is as follows:
Example
import numpy as np
ypoints = np.array([6, 2, 13, 10])
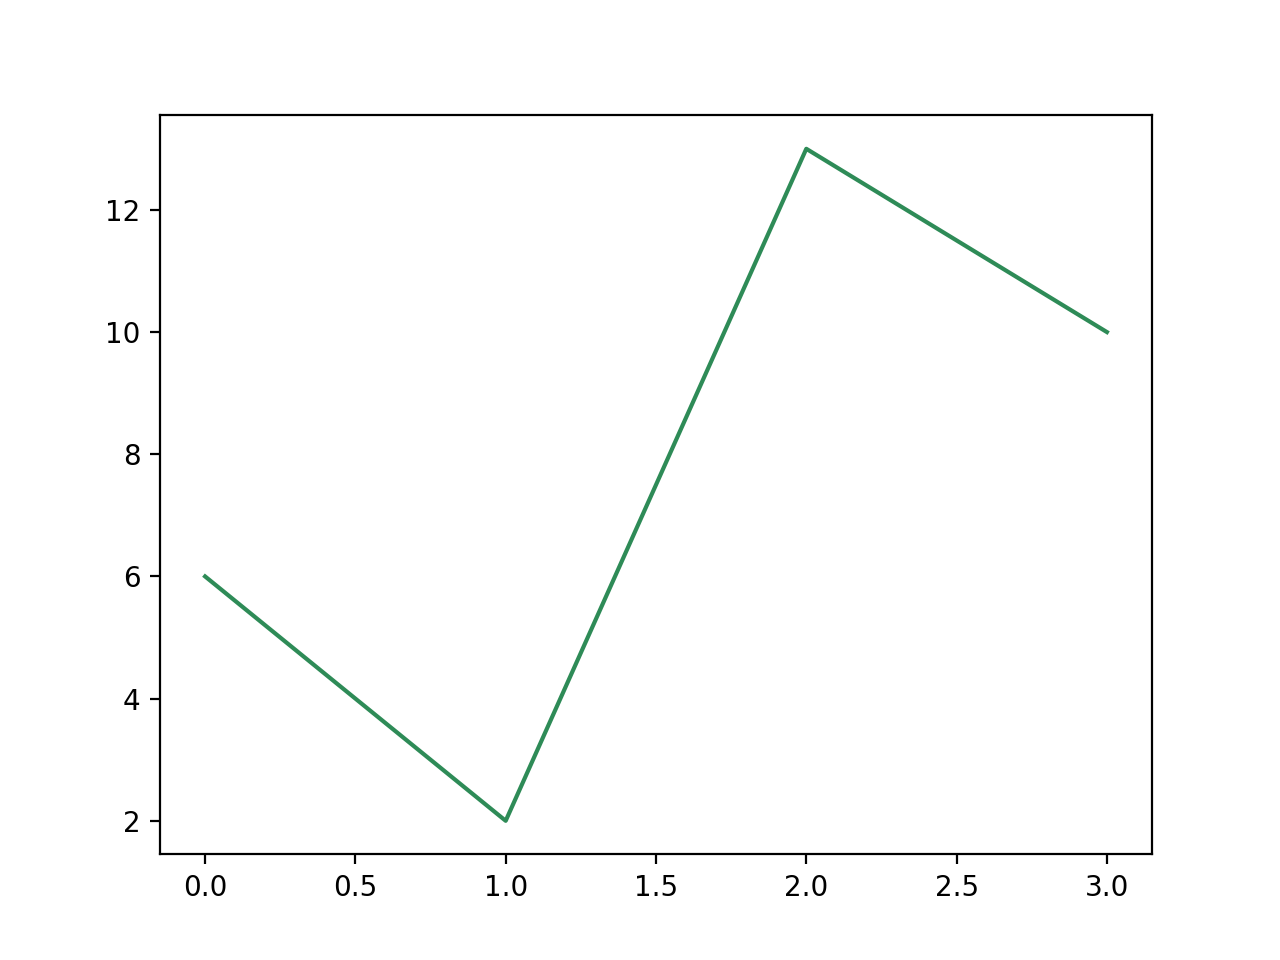
plt.plot(ypoints, c = 'SeaGreen')
plt.show()
The display result is as follows:
Line Width
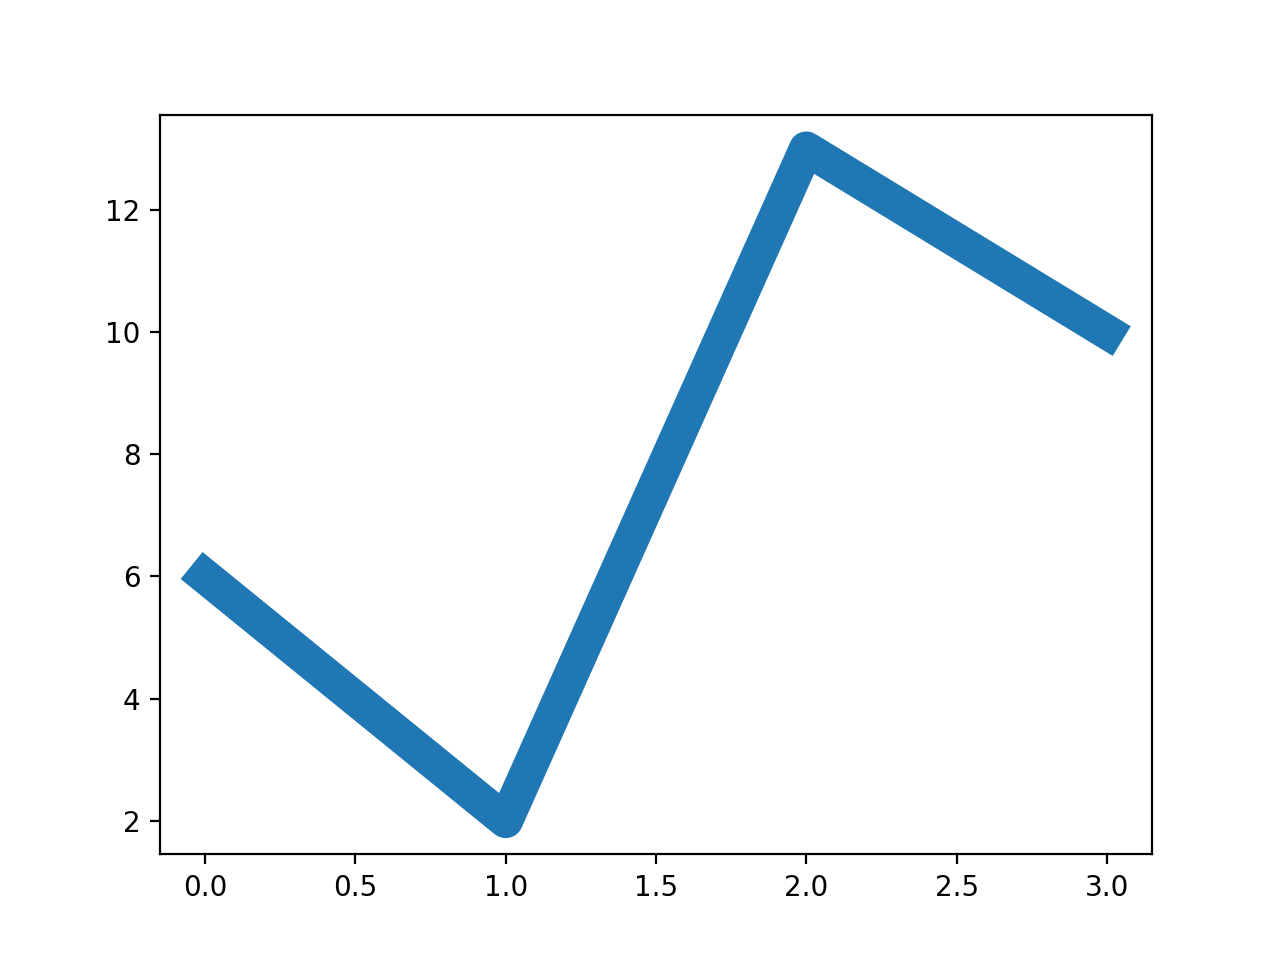
The line width can be set using the linewidth parameter, abbreviated aslw, the value can be a floating point number, such as:1、2.0、5.67etc.
Example
import numpy as np
ypoints = np.array([6, 2, 13, 10])
plt.plot(ypoints, linewidth = '12.5')
plt.show()
The display result is as follows:
Multiple Lines
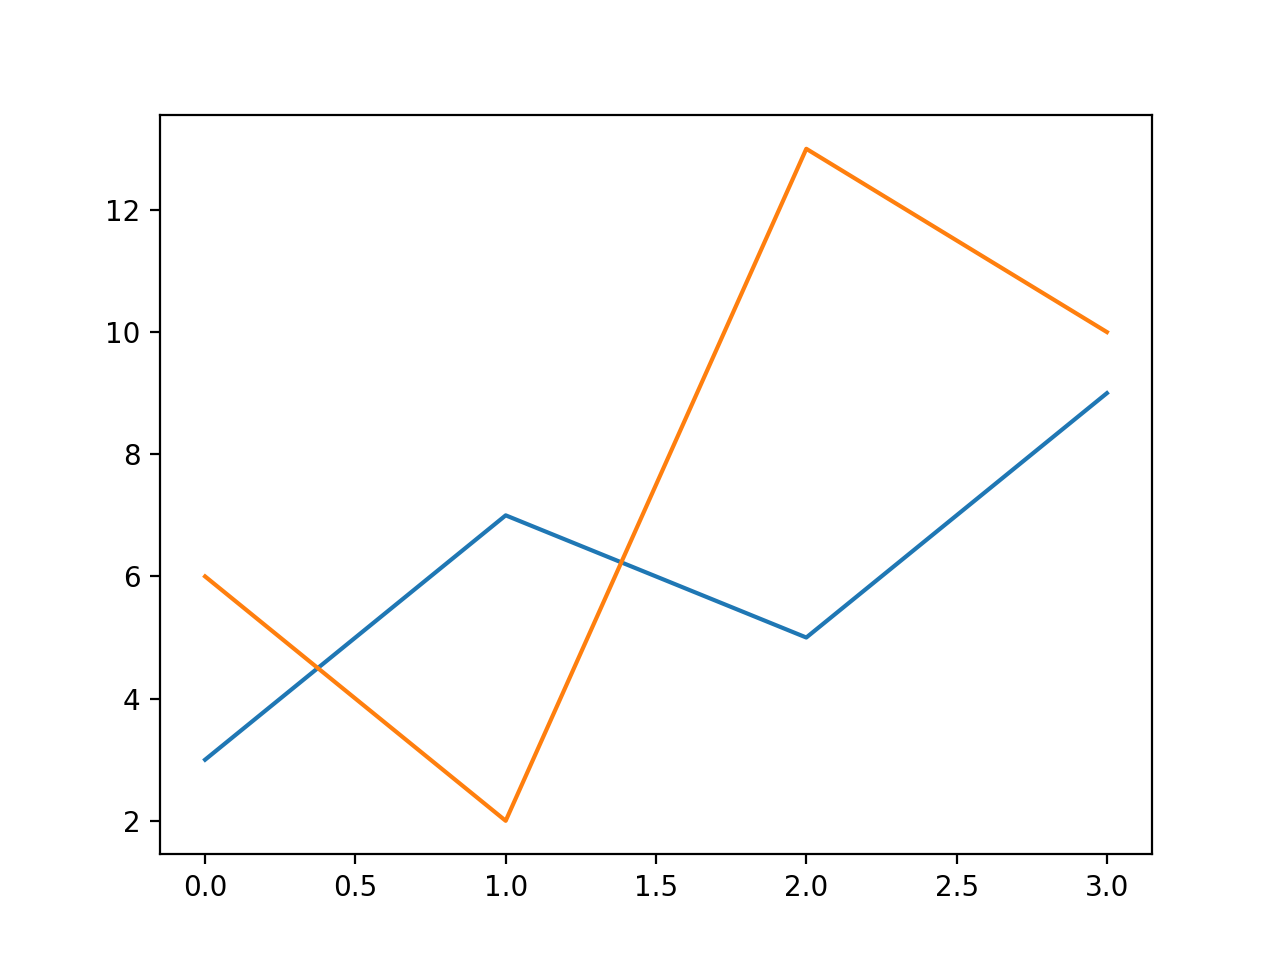
The plot() method can contain multiple pairs of x, y values to draw multiple lines.
Example
import numpy as np
y1 = np.array([3, 7, 5, 9])
y2 = np.array([6, 2, 13, 10])
plt.plot(y1)
plt.plot(y2)
plt.show()
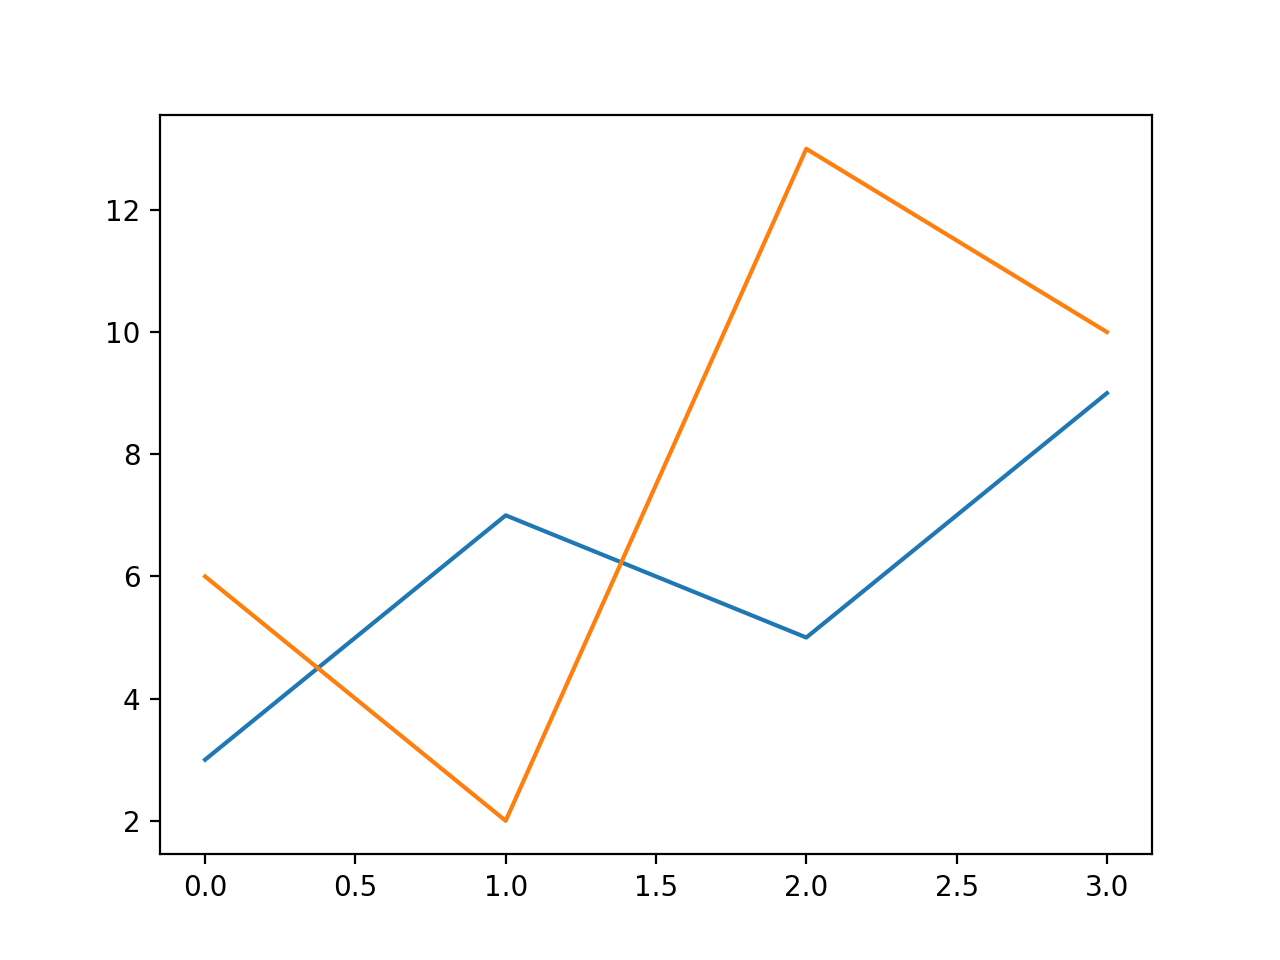
As can be seen from the figure abovexthe value is set to by default[0, 1, 2, 3]。
The display result is as follows:
We can also set the x-coordinate values ourselves:
Example
import numpy as np
x1 = np.array([0, 1, 2, 3])
y1 = np.array([3, 7, 5, 9])
x2 = np.array([0, 1, 2, 3])
y2 = np.array([6, 2, 13, 10])
plt.plot(x1, y1, x2, y2)
plt.show()
The display result is as follows: