Matplotlib Pyplot
Pyplot is a sub-library of Matplotlib that provides a plotting API similar to MATLAB.
Pyplot is a commonly used plotting module that makes it easy for users to draw 2D charts.
Pyplot contains a series of related plotting functions. Each function makes some modifications to the current image, for example: adding markers to the image, generating a new image, creating a new plotting area in the image, etc.
When using it, we can use import to import the pyplot library and set an aliasplt:
In this way, we can usepltto reference the methods of the Pyplot package.
The following are some commonly used pyplot functions:
plot(): used for drawing line plots and scatter plotsscatter(): used for drawing scatter plotsbar(): used for drawing vertical bar charts and horizontal bar chartshist(): used for drawing histogramspie(): used for drawing pie chartsimshow(): used for drawing imagessubplots(): used for creating subplots
In addition to these basic functions, pyplot also provides many other functions, such as functions for setting chart properties, functions for adding text and annotations, functions for saving charts to files, and so on.
In the following example, we use two coordinates(0,0)to(6,100)to draw a line:
Example
import numpy as np
xpoints = np.array([0, 6])
ypoints = np.array([0, 100])
plt.plot(xpoints, ypoints)
plt.show()
The output result is as follows:
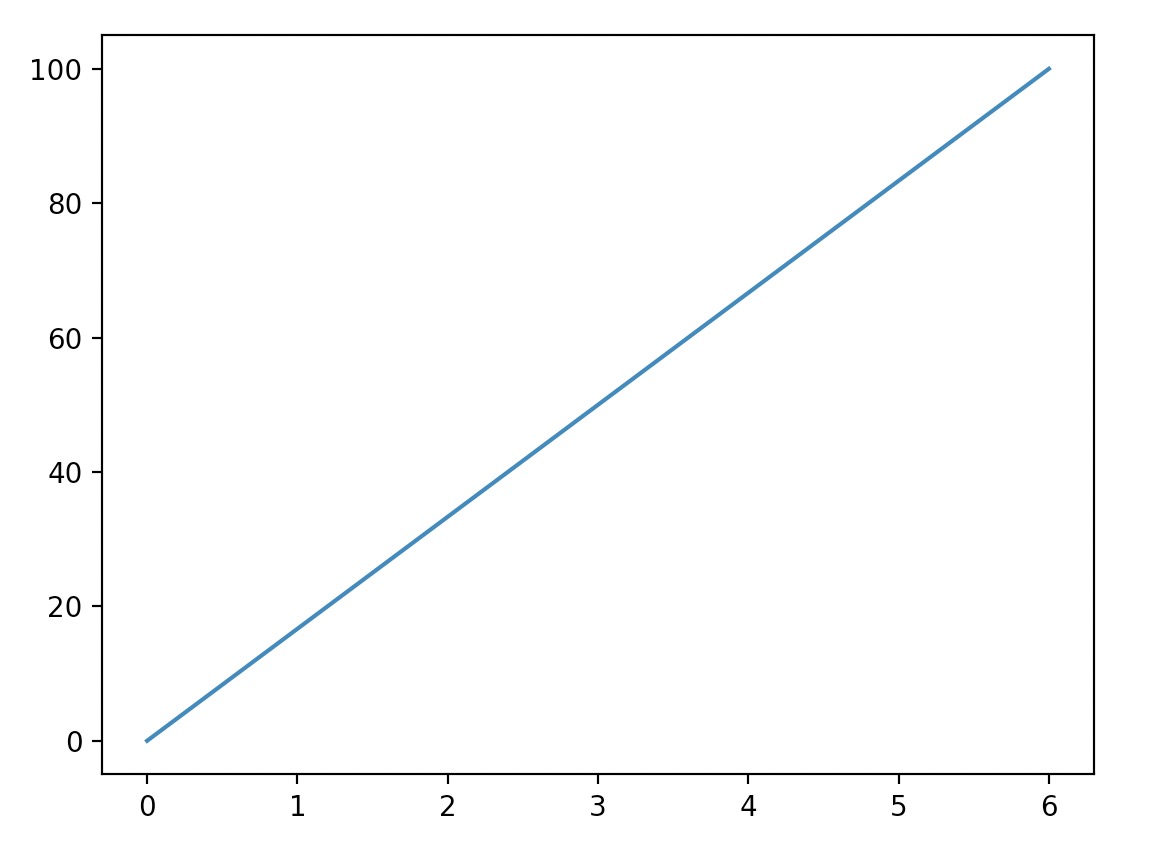
In the above example, we used Pyplot'splot()function,plot()The function is the most basic function for drawing 2D graphics.
plot()It is used for drawing. It can draw points and lines. The syntax format is as follows:
# 画单条线
plot([x], y, [fmt], *, data=None, **kwargs)
# 画多条线
plot([x], y, [fmt], [x2], y2, [fmt2], ..., **kwargs)
Parameter description:
- x, y:The nodes of points or lines, x is the x-axis data, y is the y-axis data. The data can be a list or an array.
- fmt:Optional, defines the basic format (such as color, marker, and line style).
- **kwargs:Optional, used on 2D plots to set specified properties, such as labels, line width, etc.
>>> plot(x, y, 'bo') # Create a 2D line plot of the data in y versus the corresponding values in x, drawn with blue solid circles
>>> plot(y) # x values are 0..N-1
>>> plot(y, 'r+') # Use red + signs
Color characters:'b' blue, 'm' magenta, 'g' green, 'y' yellow, 'r' red, 'k' black, 'w' white, 'c' cyan, '#0053A6' RGB color string. When multiple curves do not specify a color, they will automatically select different colors.
Line style parameters:'-' solid line, '--' dashed line, '-.' dash-dot line, ':' dotted line.
Marker characters:'.' point marker, ',' pixel marker (very small point), 'o' solid circle marker, 'v' inverted triangle marker, '^' upward triangle marker, '>' right triangle marker, '<' left triangle marker... and so on.
If we want to draw a line from coordinates (1, 3) to (8, 10), we need to pass two arrays [1, 8] and [3, 10] toplotfunction:
Example
import numpy as np
xpoints = np.array([1, 8])
ypoints = np.array([3, 10])
plt.plot(xpoints, ypoints)
plt.show()
The output result of the above code is:
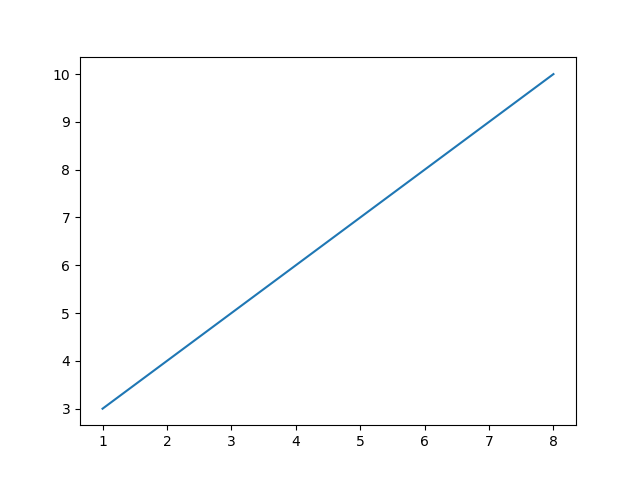
If we only want to plot two coordinate points instead of a line, we can useoparameter, which represents a solid circle marker:
Plot two points with coordinates (1, 3) and (8, 10)
import numpy as np
xpoints = np.array([1, 8])
ypoints = np.array([3, 10])
plt.plot(xpoints, ypoints, 'o')
plt.show()
The output result of the above code is:
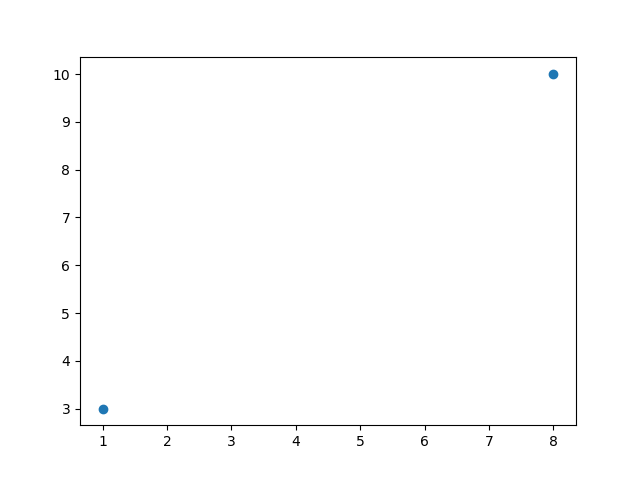
We can also plot any number of points, just ensure that the number of points on both axes is the same.
Draw an irregular line with coordinates (1, 3), (2, 8), (6, 1), (8, 10). The corresponding two arrays are: [1, 2, 6, 8] and [3, 8, 1, 10].
Example
import numpy as np
xpoints = np.array([1, 2, 6, 8])
ypoints = np.array([3, 8, 1, 10])
plt.plot(xpoints, ypoints)
plt.show()
The output result of the above code is:
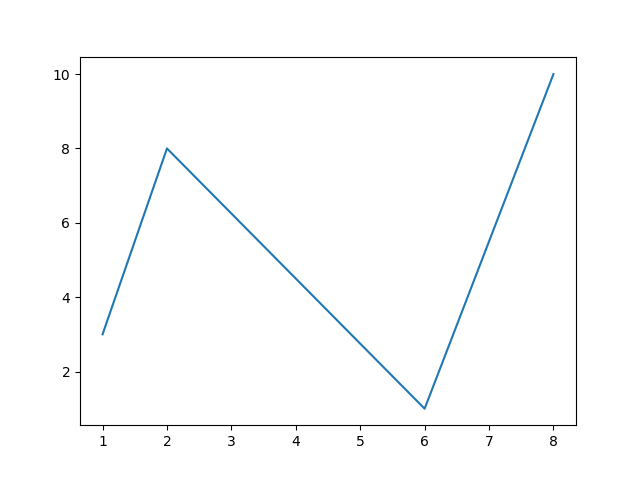
If we do not specify the points on the x-axis, then x will be set based on the values of y to 0, 1, 2, 3..N-1。
Example
import numpy as np
ypoints = np.array([3, 10])
plt.plot(ypoints)
plt.show()
The output result of the above code is:
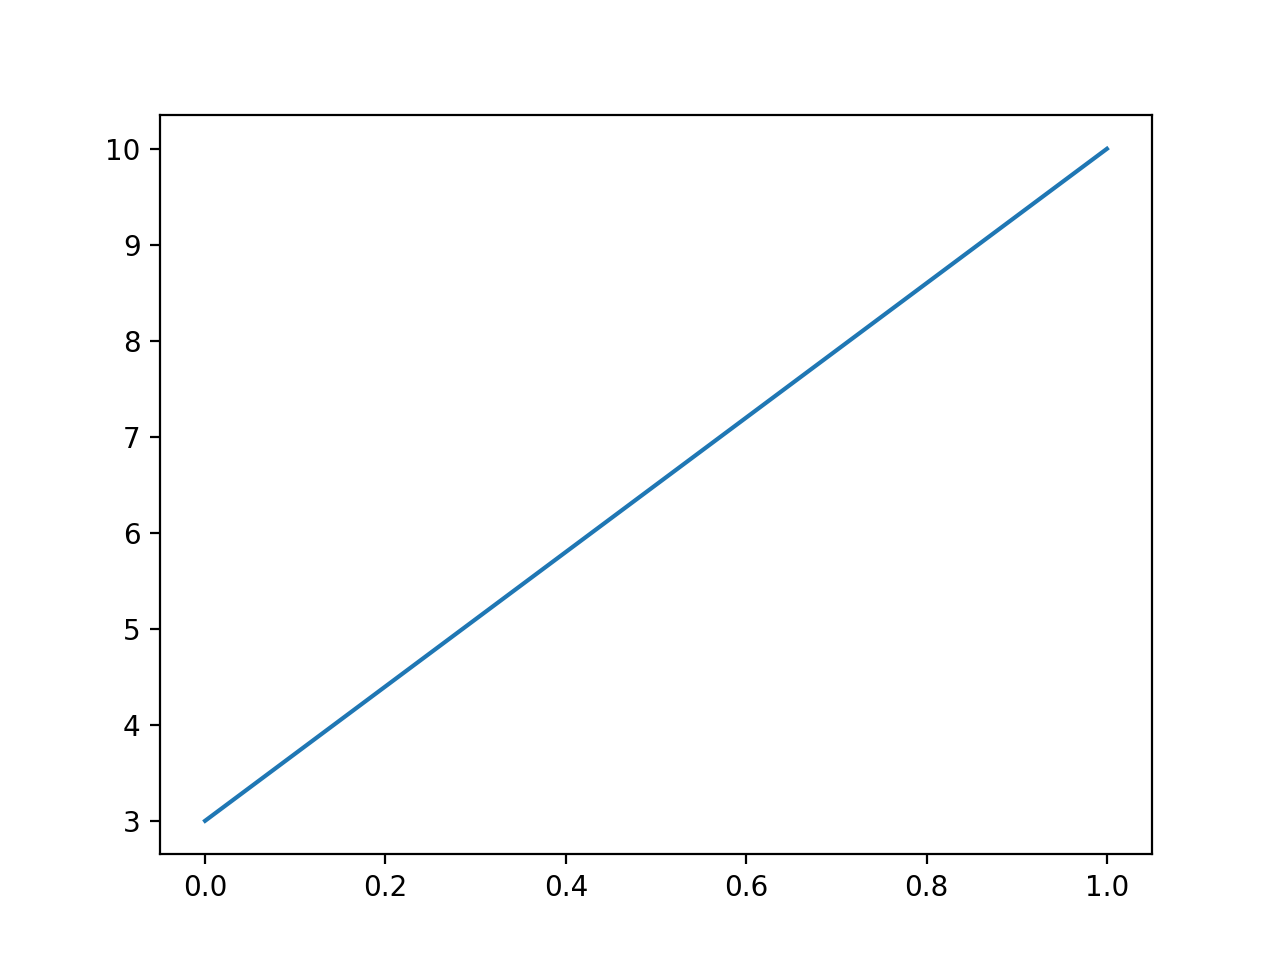
From the figure above, it can be seen that the value of x is set to by default [0, 1]。
Let's look at another example with more values:
Example
import numpy as np
ypoints = np.array([3, 8, 1, 10, 5, 7])
plt.plot(ypoints)
plt.show()
The output result of the above code is:
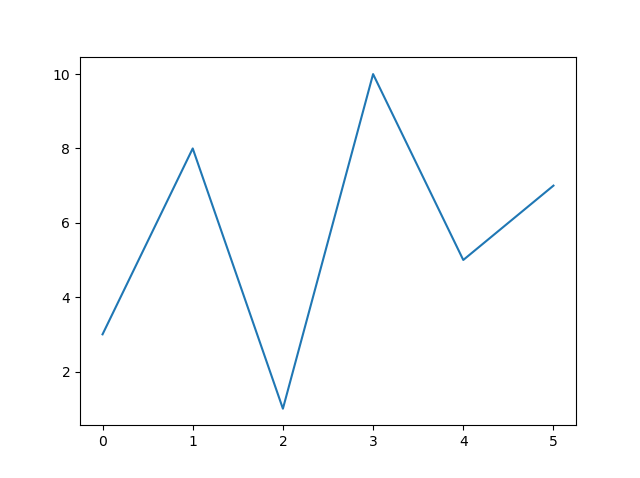
From the figure above, it can be seen thatxthe value of is set to by default[0, 1, 2, 3, 4, 5]。
In the following example, we plot a sine and cosine graph. In the plt.plot() parameters, we include two pairs ofx,yvalues. The first pair is x,y, which corresponds to the sine function. The second pair isx,z, which corresponds to the cosine function.
Example
import numpy as np
x = np.arange(0,4*np.pi,0.1) # start,stop,step
y = np.sin(x)
z = np.cos(x)
plt.plot(x,y,x,z)
plt.show()
The output result of the above code is:
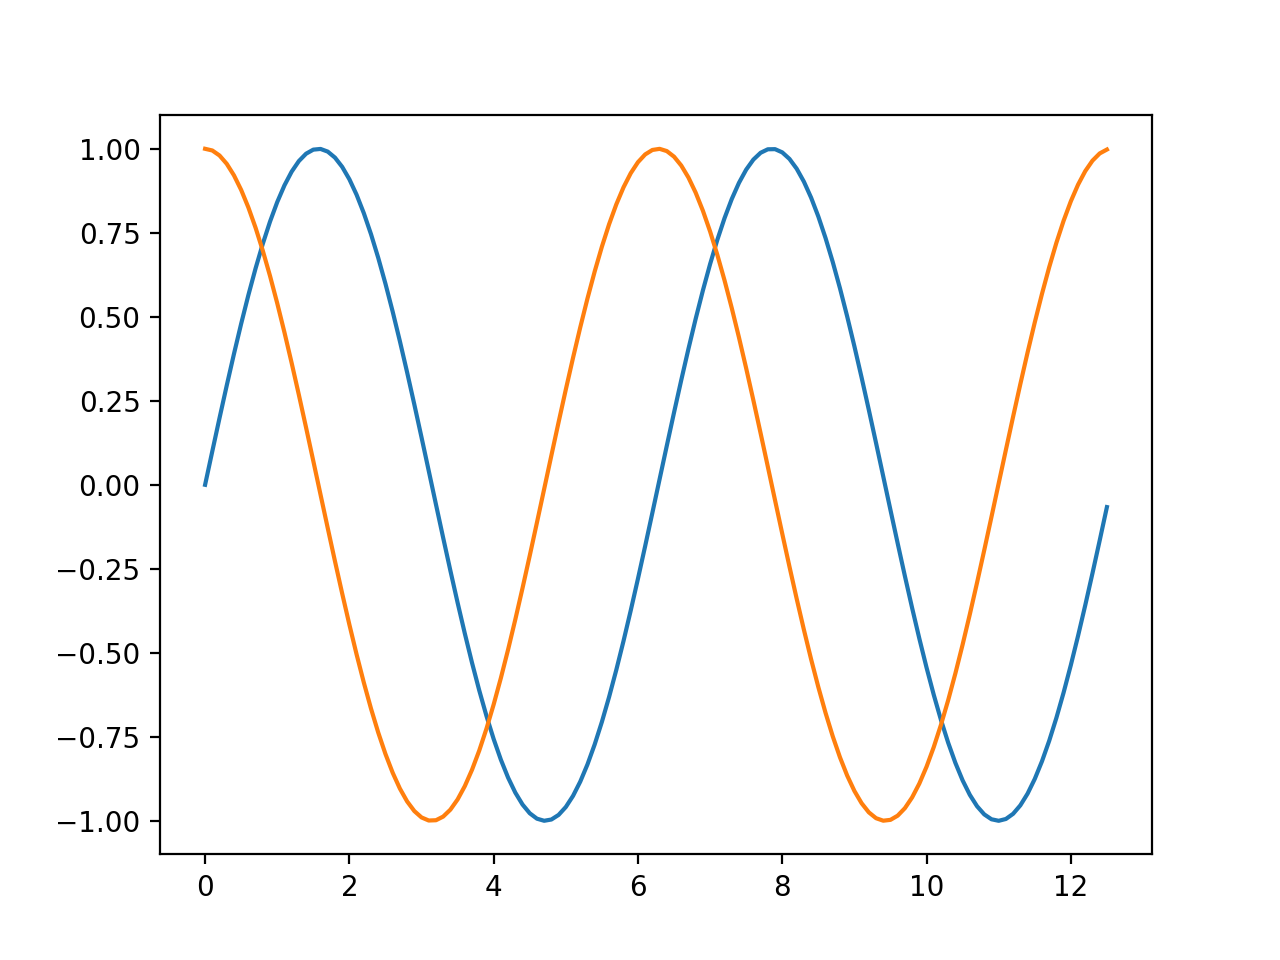
For more content, refer to:https://matplotlib.org/stable/api/_as_gen/matplotlib.pyplot.plot.html
Other extensions