Markdown Chart Drawing
Charts are very important in technical documentation; they can help us:
- Visualize complex data relationships
- Display system architecture and workflows
- Express ideas and concepts more clearly
Common Markdown Chart Tools
Mermaid
Mermaid is one of the most popular Markdown chart tools. It allows you to generate various charts using simple text syntax.
Supported chart types:
- Flowchart
- Sequence Diagram
- Class Diagram
- State Diagram
- Gantt Chart
- Pie Chart
Flowchart
```mermaid
graph TD
    A[开始] --> B{条件判断}
    B -->|Yes| C[执行操作A]
    B -->|No| D[执行操作B]
    C --> E[结束]
    D --> E
```
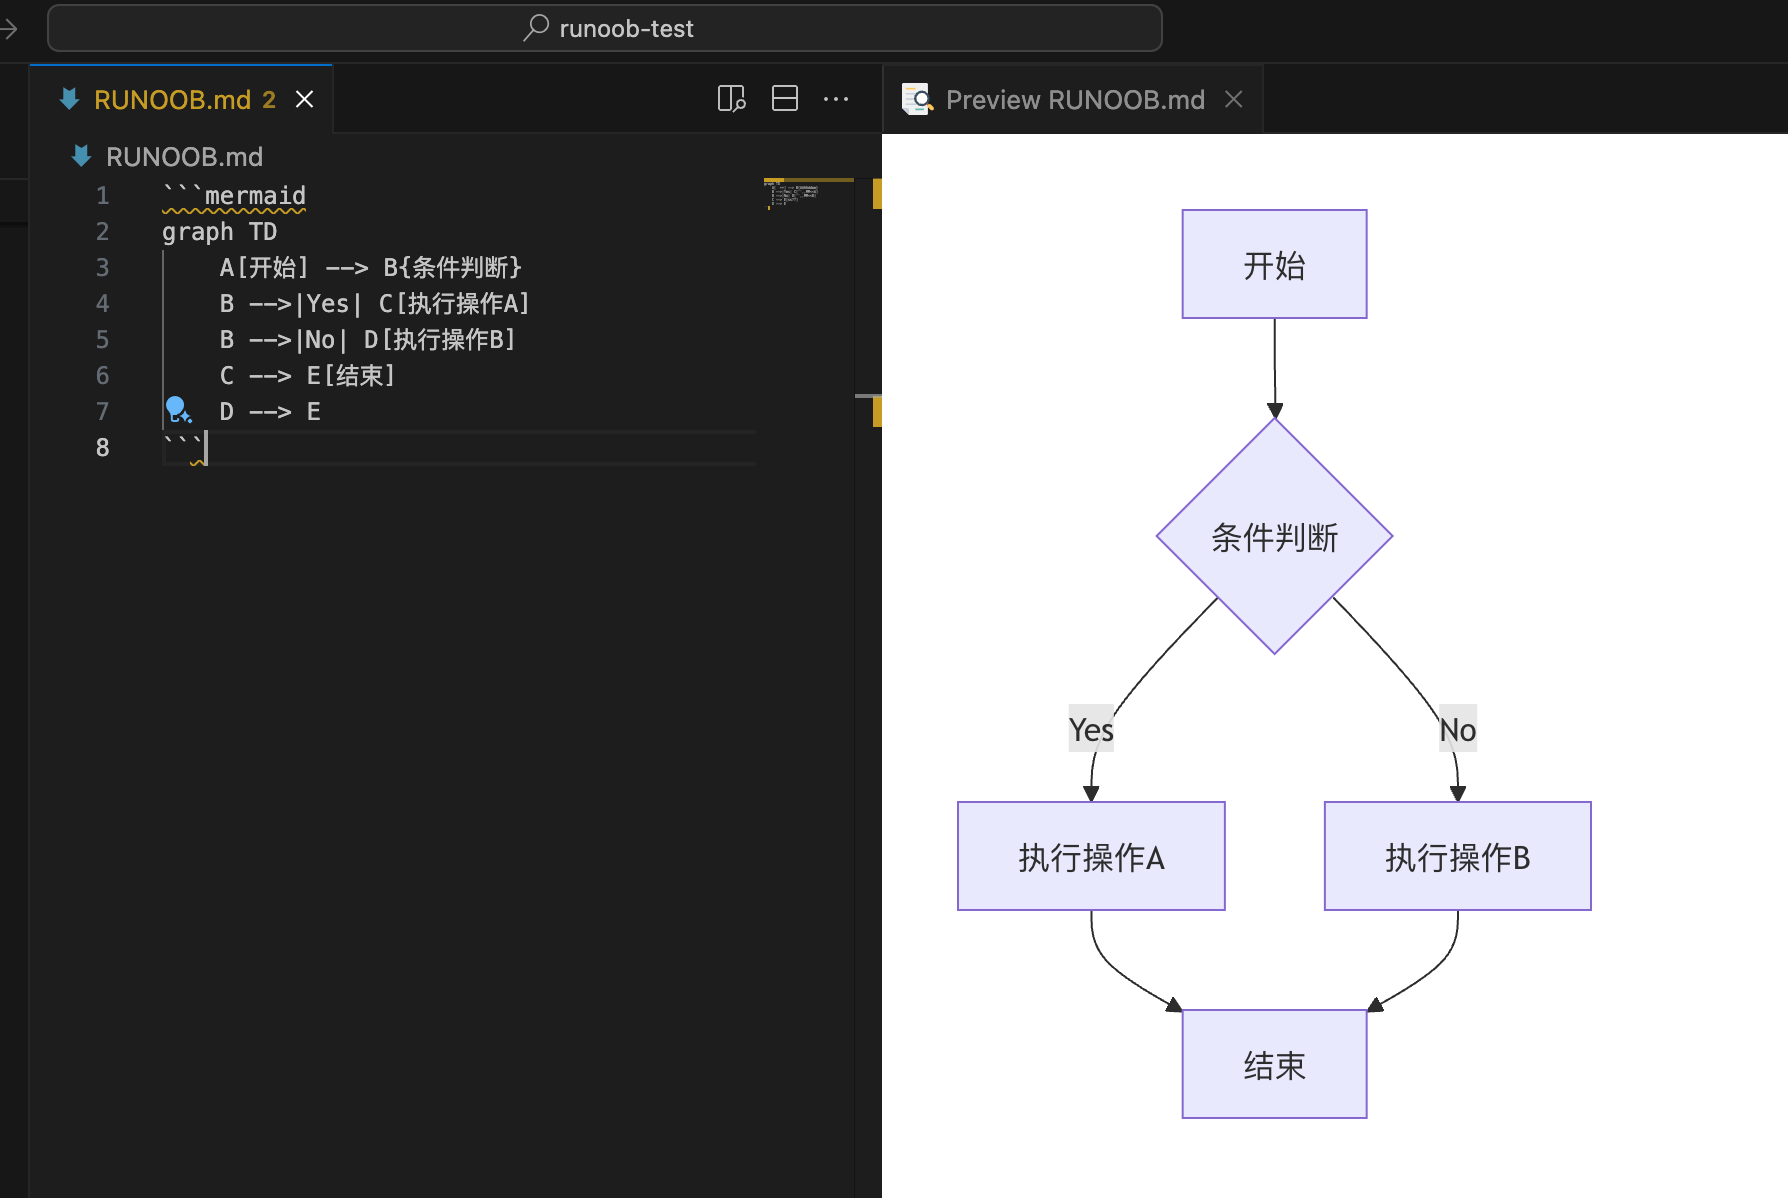
Flowchart direction
TDorTB: Top to BottomBT: Bottom to TopRL: Right to LeftLR: Left to Right
Node shapes
A[方形]: RectangleB(圆角矩形): Rounded rectangleC{菱形}: Diamond (decision)D((圆形)): CircleE>旗帜形]: Flag shape
Connection line types
-->Solid arrow-.->Dashed arrow==>Thick solid arrow--Solid line-.Dashed line
Sequence Diagram and Gantt Chart
Sequence Diagram
```mermaid
sequenceDiagram
    participant A as 用户
    participant B as 系统
    participant C as 数据库

    A->>B: 登录请求
    B->>C: 验证用户信息
    C-->>B: 返回验证结果
    B-->>A: 登录成功/失败
```
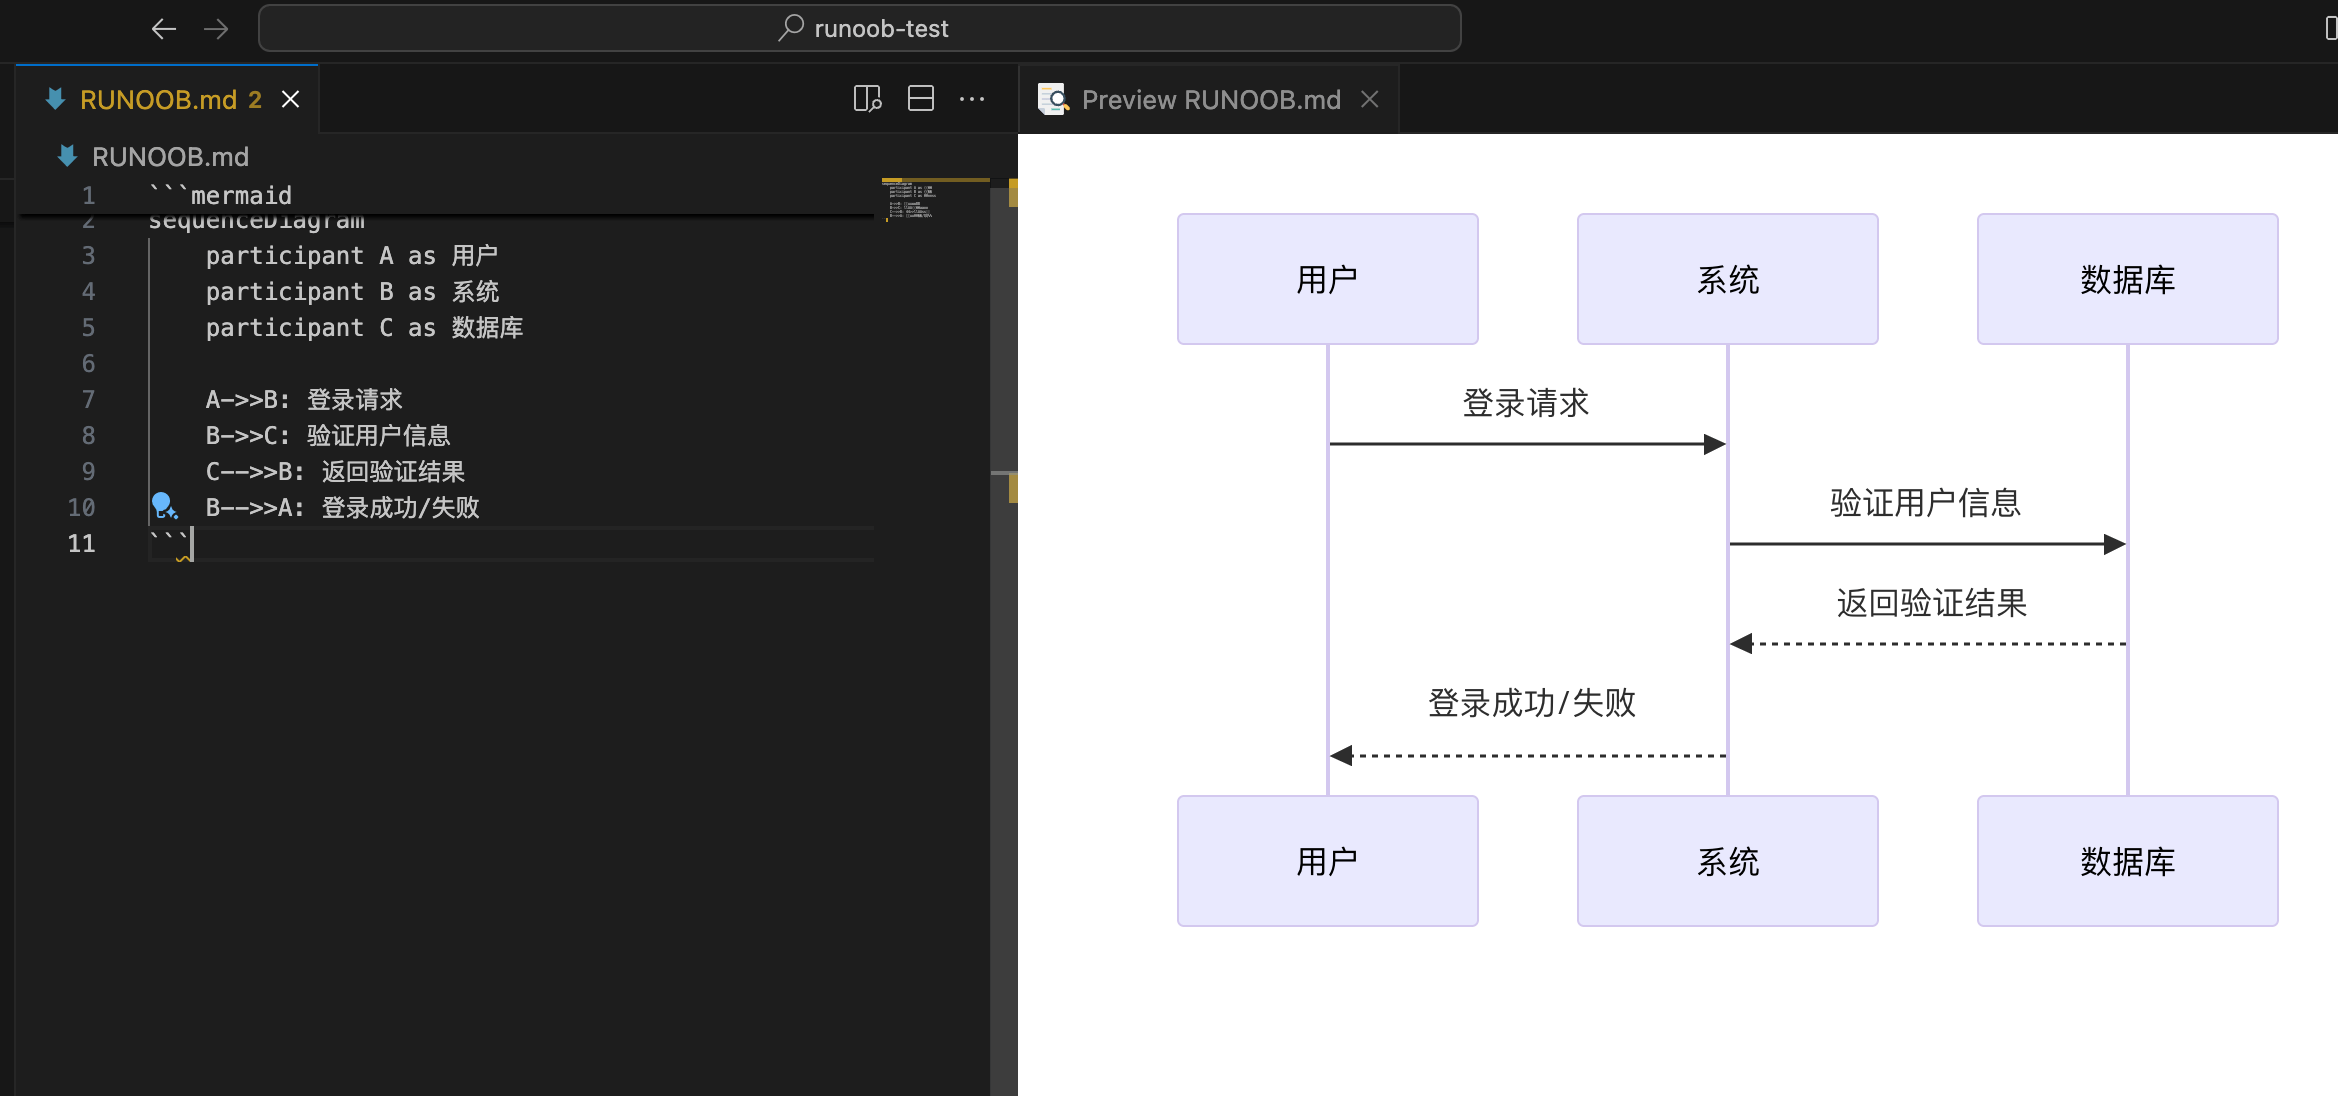
Sequence diagram syntax essentials:
participantDefine participants->>Solid arrow-->>Dashed arrownoteAdd notes
Gantt Chart
```mermaid
gantt
    title 项目开发计划
    dateFormat  YYYY-MM-DD
    section 设计阶段
    需求分析      :done,    des1, 2024-01-01,2024-01-15
    UI设计       :active,  des2, 2024-01-10, 30d
    section 开发阶段
    前端开发      :         dev1, after des2, 45d
    后端开发      :         dev2, 2024-02-01, 60d
    section 测试阶段
    单元测试      :         test1, after dev1, 15d
    集成测试      :         test2, after dev2, 10d
```
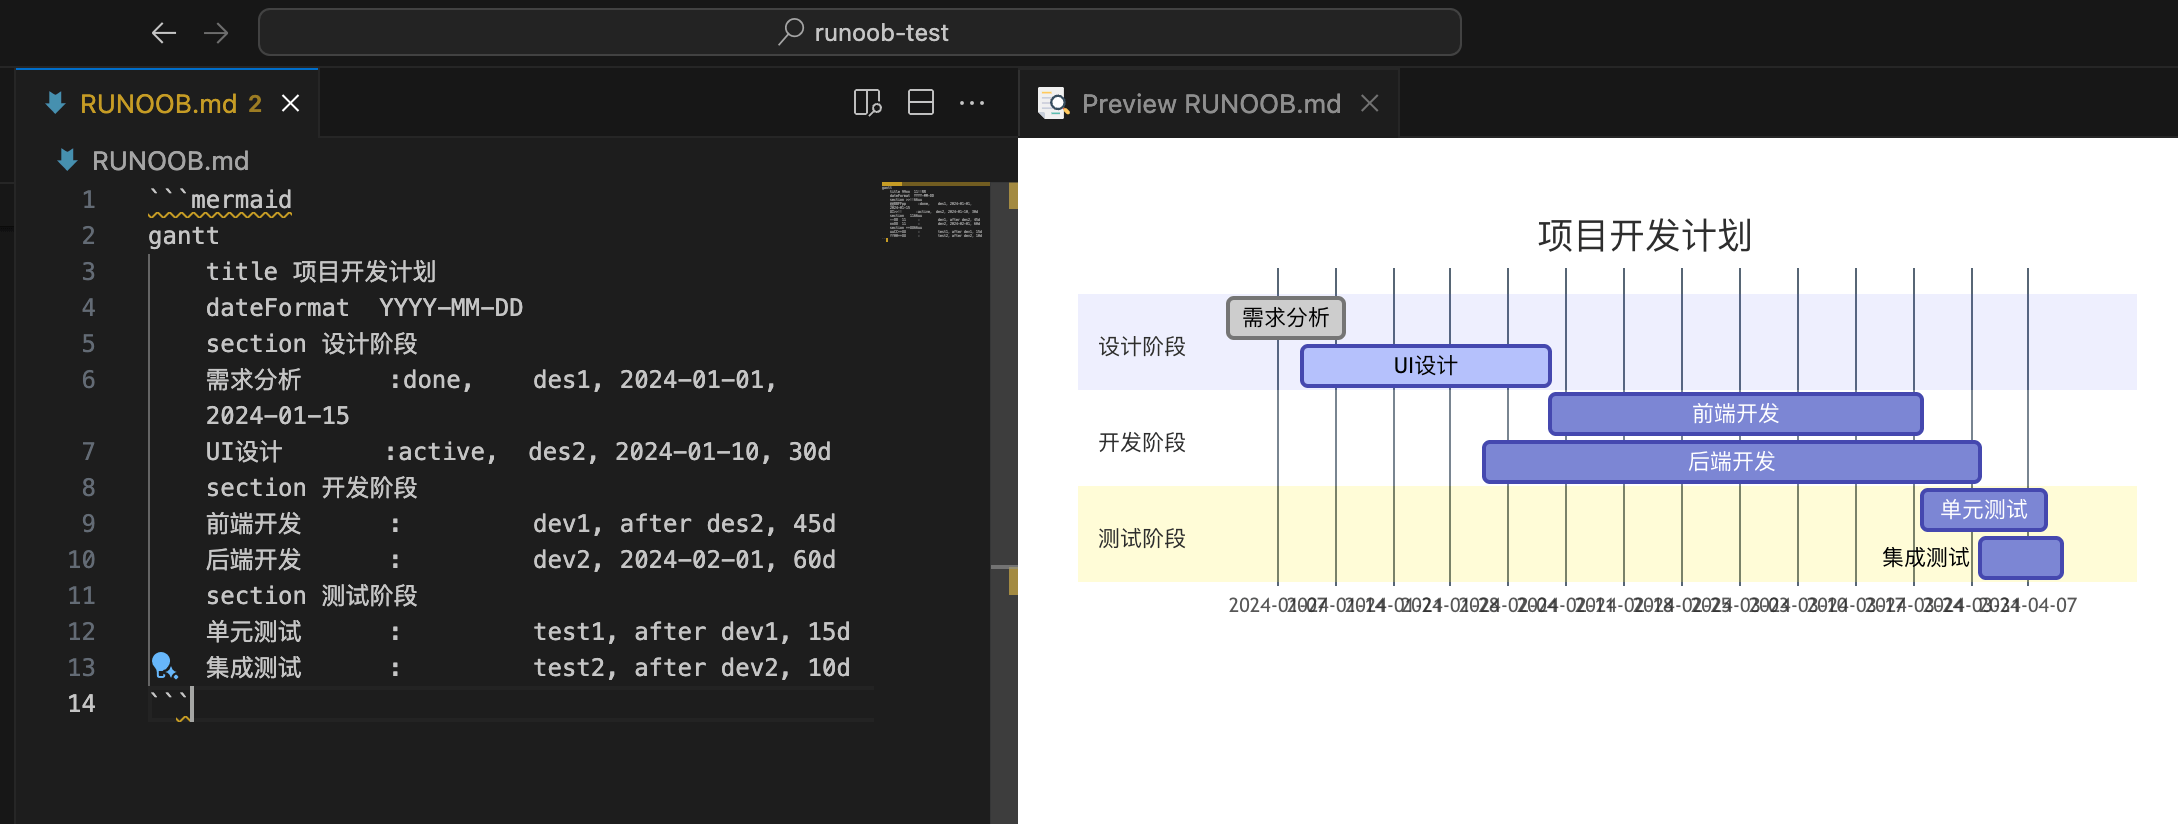
Gantt chart syntax essentials:
titleSet titledateFormatDefine date formatsectionDefine phases- Task status:
done(Completed),active(In progress),crit(Critical)
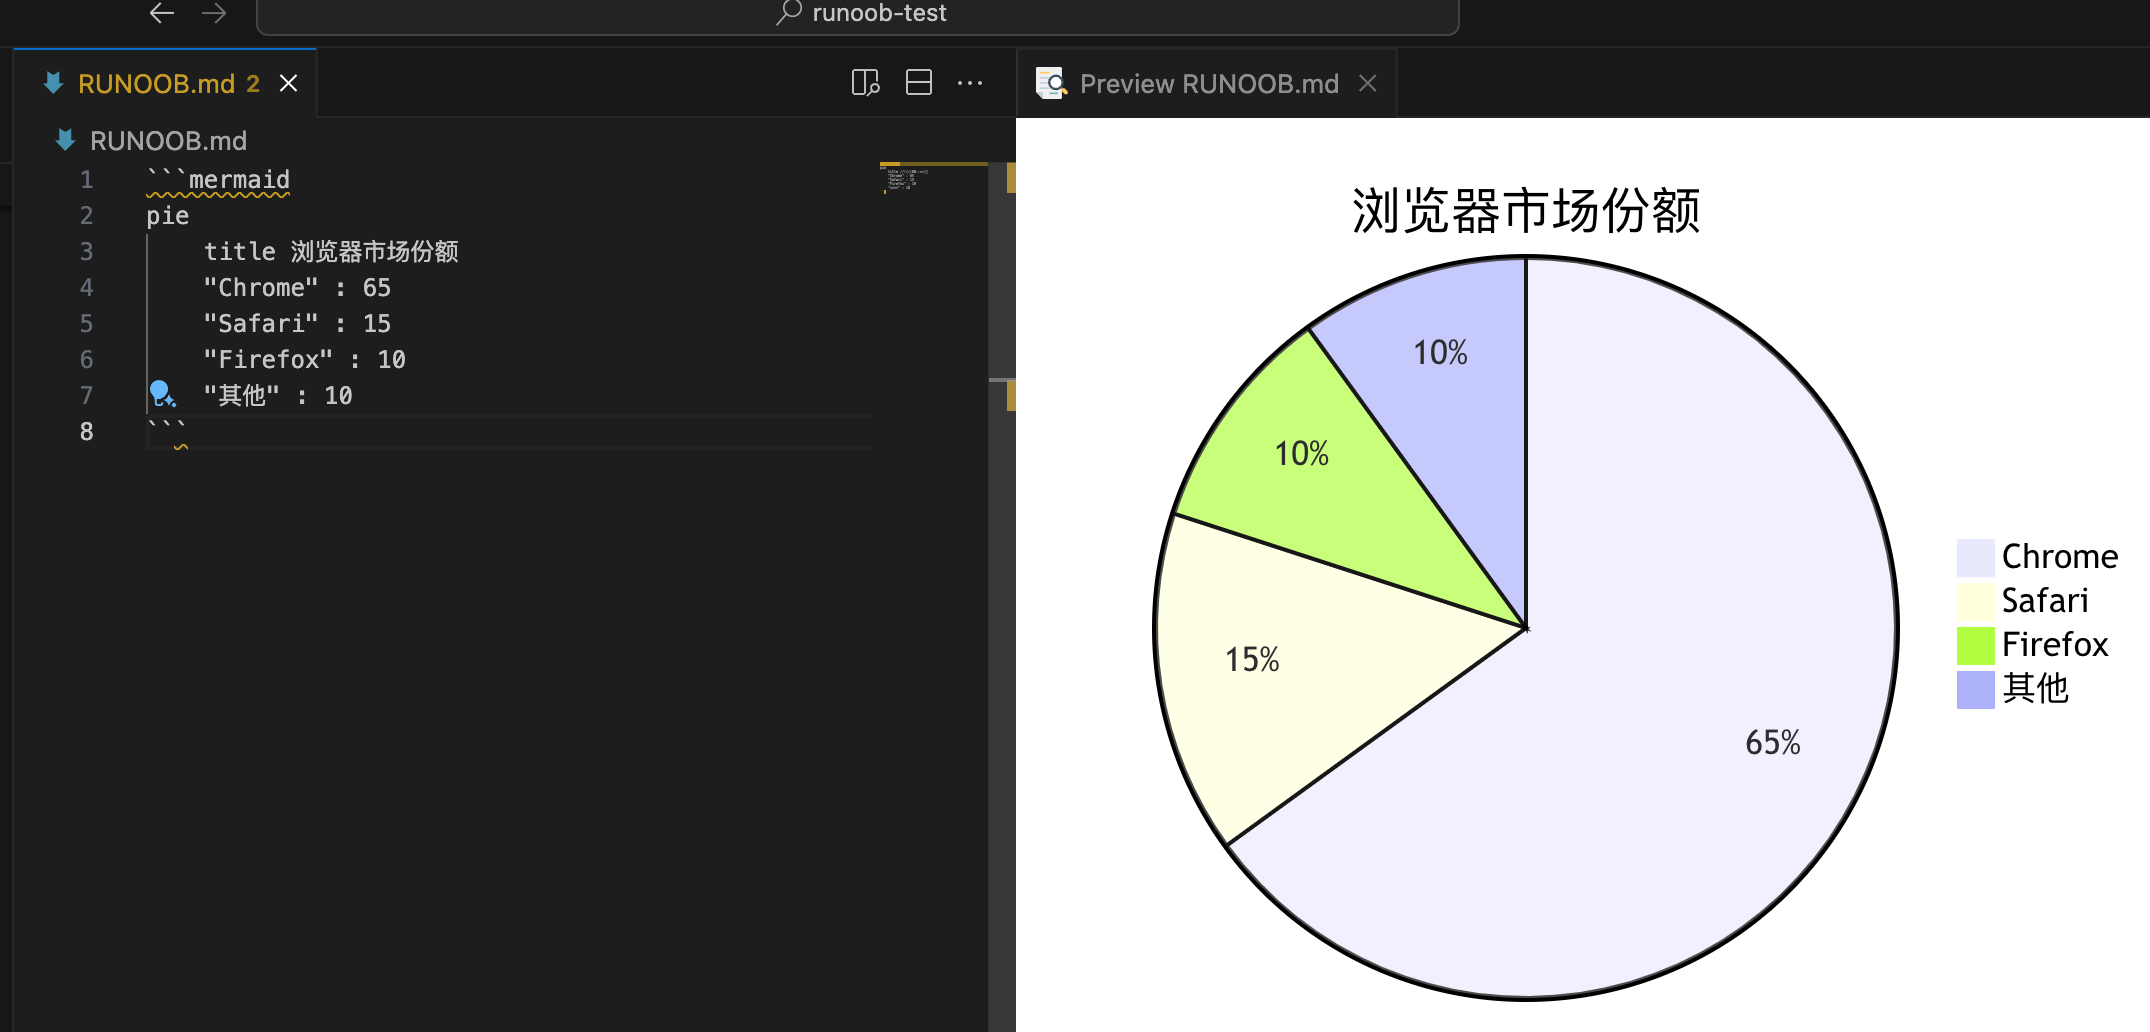
Pie Chart
```mermaid
pie
    title 浏览器市场份额
    "Chrome" : 65
    "Safari" : 15
    "Firefox" : 10
    "其他" : 10
```
Detailed Chart Types
Flowchart
Flowchart is the most commonly used chart type, used to display processes or algorithm flows.
Mermaid example:
```mermaid
graph LR
    A[开始] --> B{条件判断}
    B -->|是| C[执行操作1]
    B -->|否| D[执行操作2]
    C --> E[结束]
    D --> E
```
Syntax explanation:
graphDeclare flowchartLRIndicates left-to-right layout (optional TB/RL/BT)-->Indicates arrow connection[]Indicates rectangle node{}Indicates diamond condition node
Sequence Diagram
Sequence diagram shows the interaction order between objects.
Mermaid example:
```mermaid
sequenceDiagram
    participant 用户
    participant 系统
    用户->>系统: 登录请求
    系统-->>用户: 验证请求
    用户->>系统: 提交凭证
    系统-->>用户: 登录成功
```
Syntax explanation:
participantDefine participants->>Indicates solid arrow-->>Indicates dashed arrow
Class Diagram
Class diagram is used for object-oriented design, showing classes and their relationships.
```mermaid
classDiagram
    class 用户 {
        +用户名: string
        +密码: string
        +登录()
    }

    class 订单 {
        +订单号: int
        +创建日期: date
        +计算总价()
    }

    用户 "1" --> "n" 订单
```
Advanced Tips
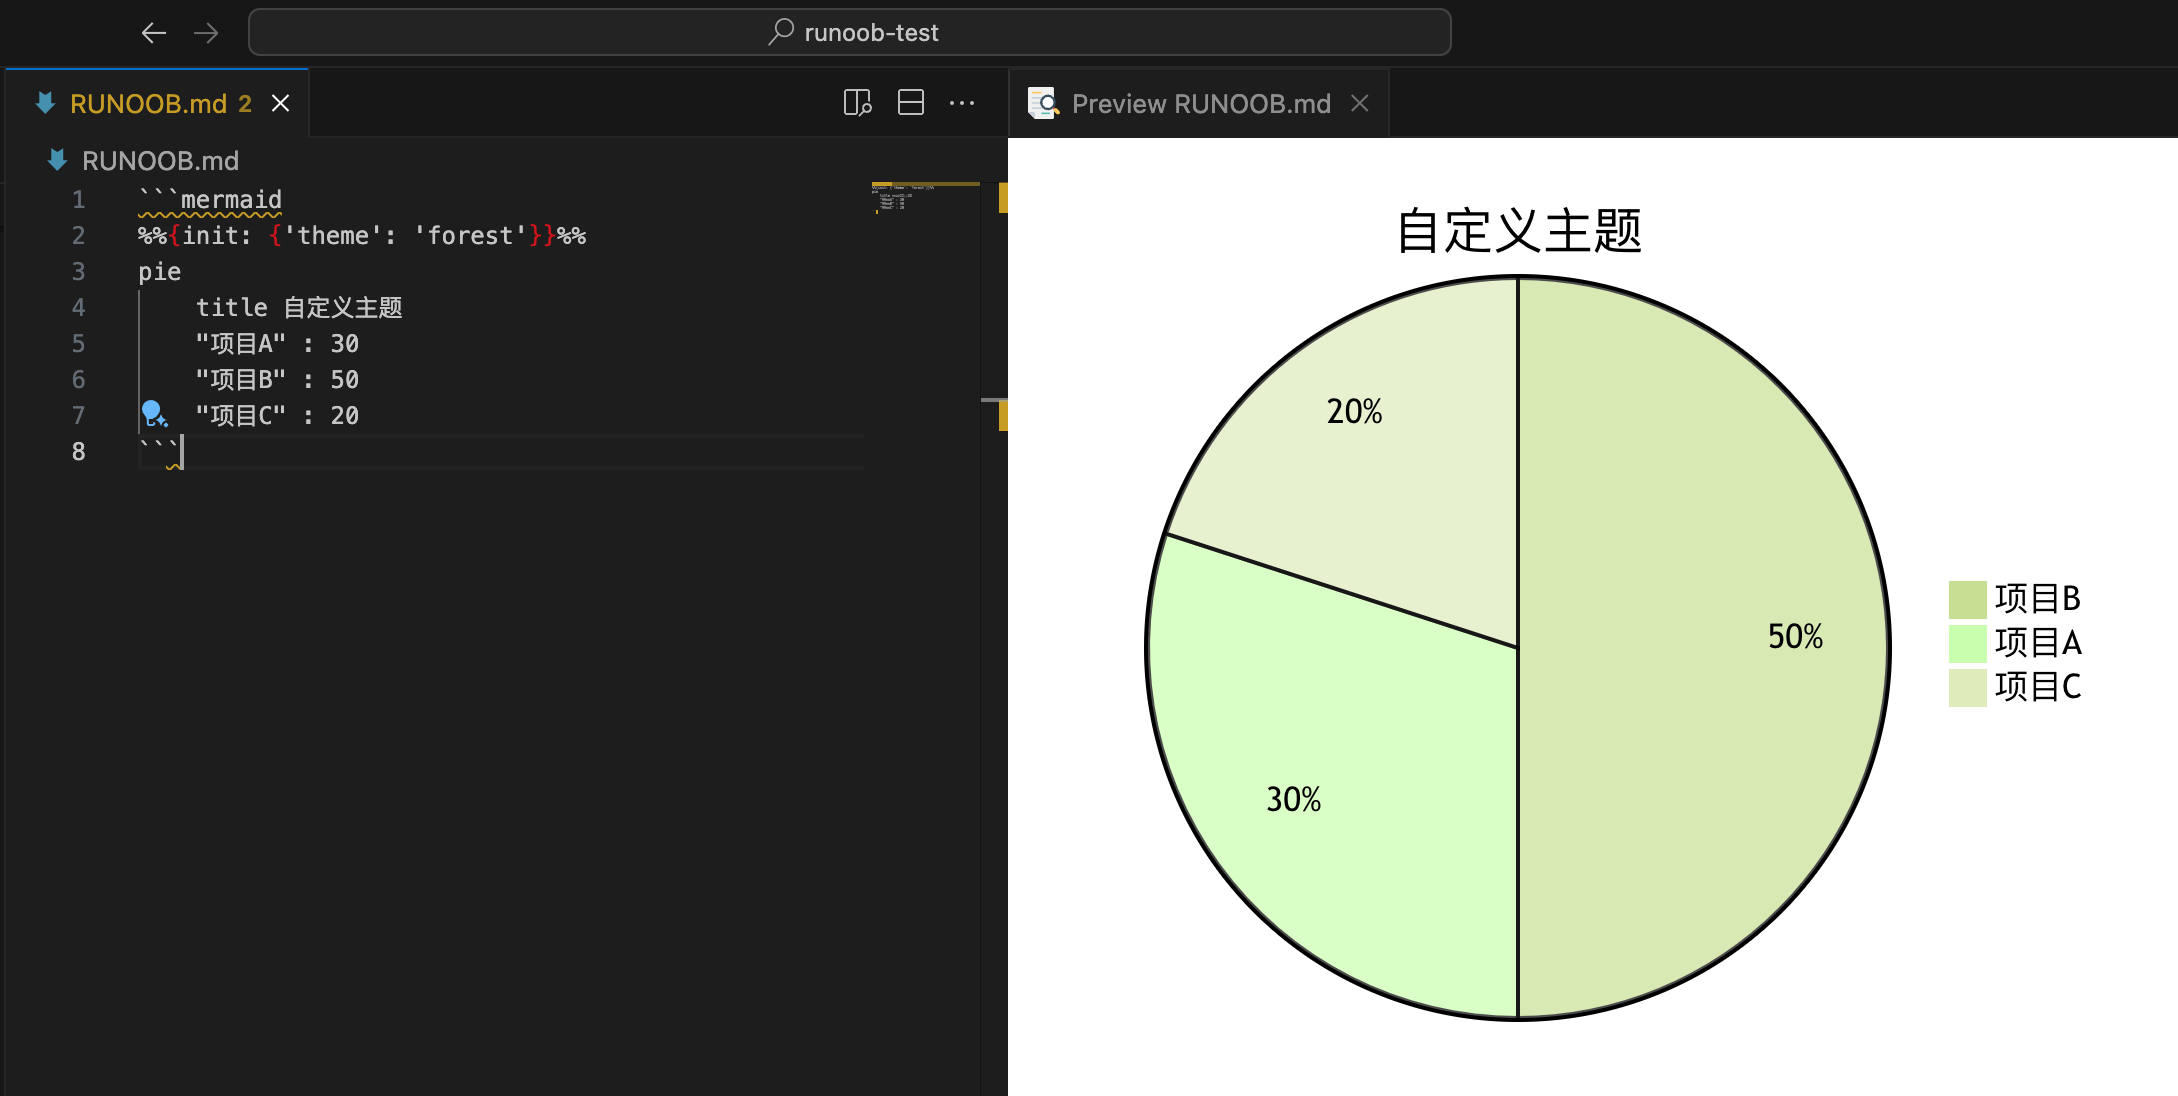
1. Theme Customization
Mermaid allows customizing chart styles:
```mermaid
%%{init: {'theme': 'forest'}}%%
pie
    title 自定义主题
    "项目A" : 30
    "项目B" : 50
    "项目C" : 20
```
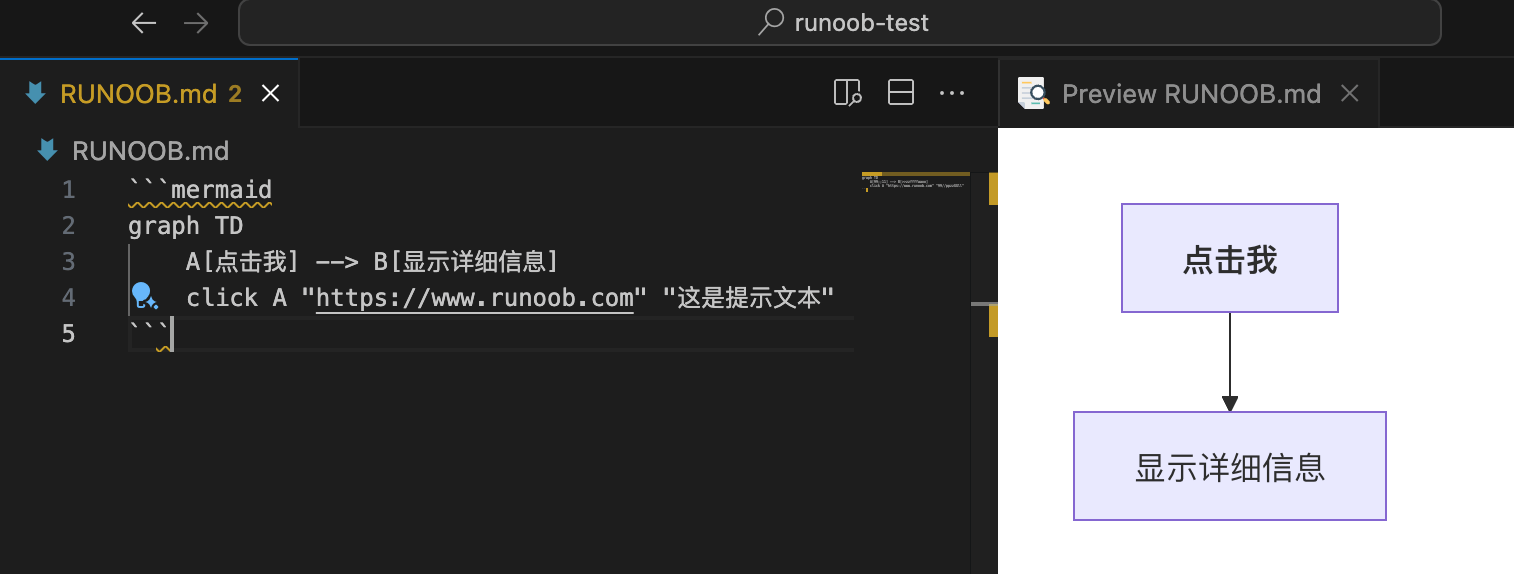
2. Interactive Charts
Some tools support adding interactive features:
```mermaid
graph TD
    A[点击我] --> B[显示详细信息]
    click A "https://www.example.com" "这是提示文本"
```
3. Exporting Charts
Most tools support exporting charts as:
- PNG images
- SVG vector graphics
- PDF documents
Tool Support Status
| Tool/Platform | Mermaid | PlantUML | Graphviz |
|---|---|---|---|
| GitHub | ✔ | ✖ | ✖ |
| GitLab | ✔ | ✔ | ✔ |
| VS Code | Plugin | Plugin | Plugin |
| Typora | ✔ | ✖ | ✖ |
| Obsidian | Plugin | Plugin | Plugin |
Best Practices
- Keep it simple: Charts should be simple and clear, avoid too much detail
- Consistent style: Charts in the same document should maintain a consistent style
- Add explanations: Add textual explanations for complex charts
- Version control: Text-based charts work well with Git
- Test rendering: Test chart display on different platforms
FAQ
Q1: Why can't my chart display?
- Check whether you're using the correct syntax
- Make sure your Markdown editor/platform supports the chart tool
- Check for syntax errors
Q2: How do I learn these chart syntaxes?
- Refer to official documentation:
- Practice in real time with an online editor
Q3: Is there a visual editor?
- Mermaid Live Editor: https://mermaid.live
- PlantUML Server: http://www.plantuml.com/plantuml