VSCode Interface Description
1. Startup Page
After completing VSCode installation, click the VSCode icon and the startup screen appears as follows:
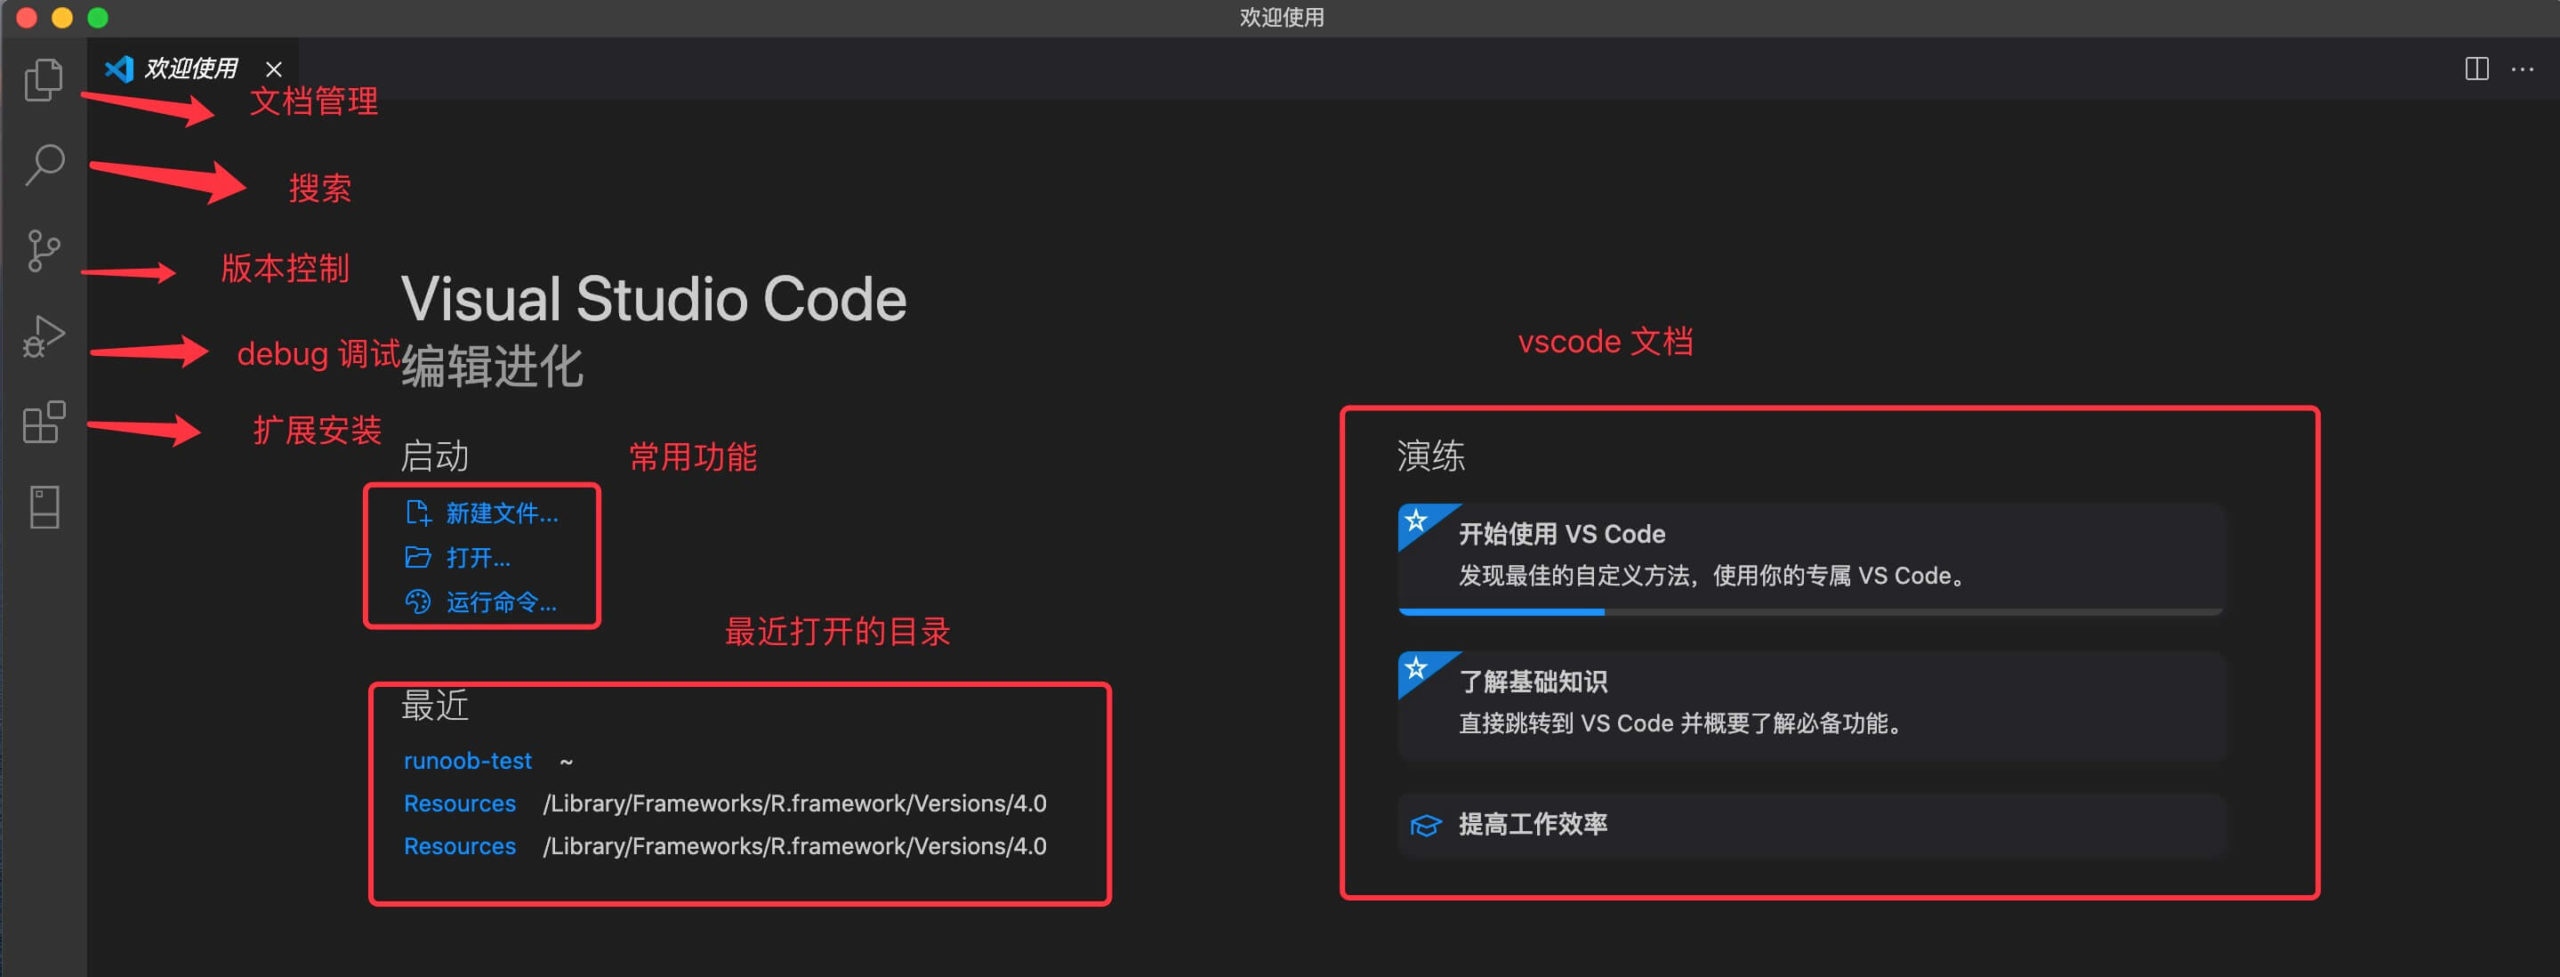
The image above shows the welcome screen of Visual Studio Code (VS Code). It is the start page of a code editor, providing quick access to different features and resources.
The following is a description of each part in the image:
Activity Bar:
- Located on the left side, it contains multiple icons, each representing a functional view of VS Code.
- Four functions are marked with red arrows in the image:
- Document Management: Possibly refers to the Explorer, used for managing files and folders.
- Search: Used to search for files or text across the entire workspace.
- Version Control: Usually integrated with Git for code version management.
- Debug: Used to start a debug session for code debugging.
Start:
- Located above the Activity Bar, it contains shortcuts for common functions.
- Three options are marked with red boxes in the image:
- New File: Create a new file.
- Open...: Open a file or folder.
- Run Command...: Execute commands using the Command Palette.
Recently Opened Folders (Recent):
- Displays a list of recently opened folders, making it easy to quickly switch to a previous working directory.
- The recently opened folders are marked with a red box in the image, for example "example-test".
Walkthrough (Tutorial):
- Located on the right side of the welcome screen, it provides some quick links to help users learn about and use VS Code.
- Three links are marked with red boxes in the image:
- Get Started with VS Code: Provides guidance on customization methods and using VS Code specifically.
- Learn the Basics: Links to VS Code basics, helping users understand essential features.
- Improve Productivity: Provides tips to improve efficiency when using VS Code.
VS Code Documentation:
- Located above the Walkthrough section, it is likely a link to the official VS Code documentation.
2. Editing Page
The interface for opening or editing code is shown below:
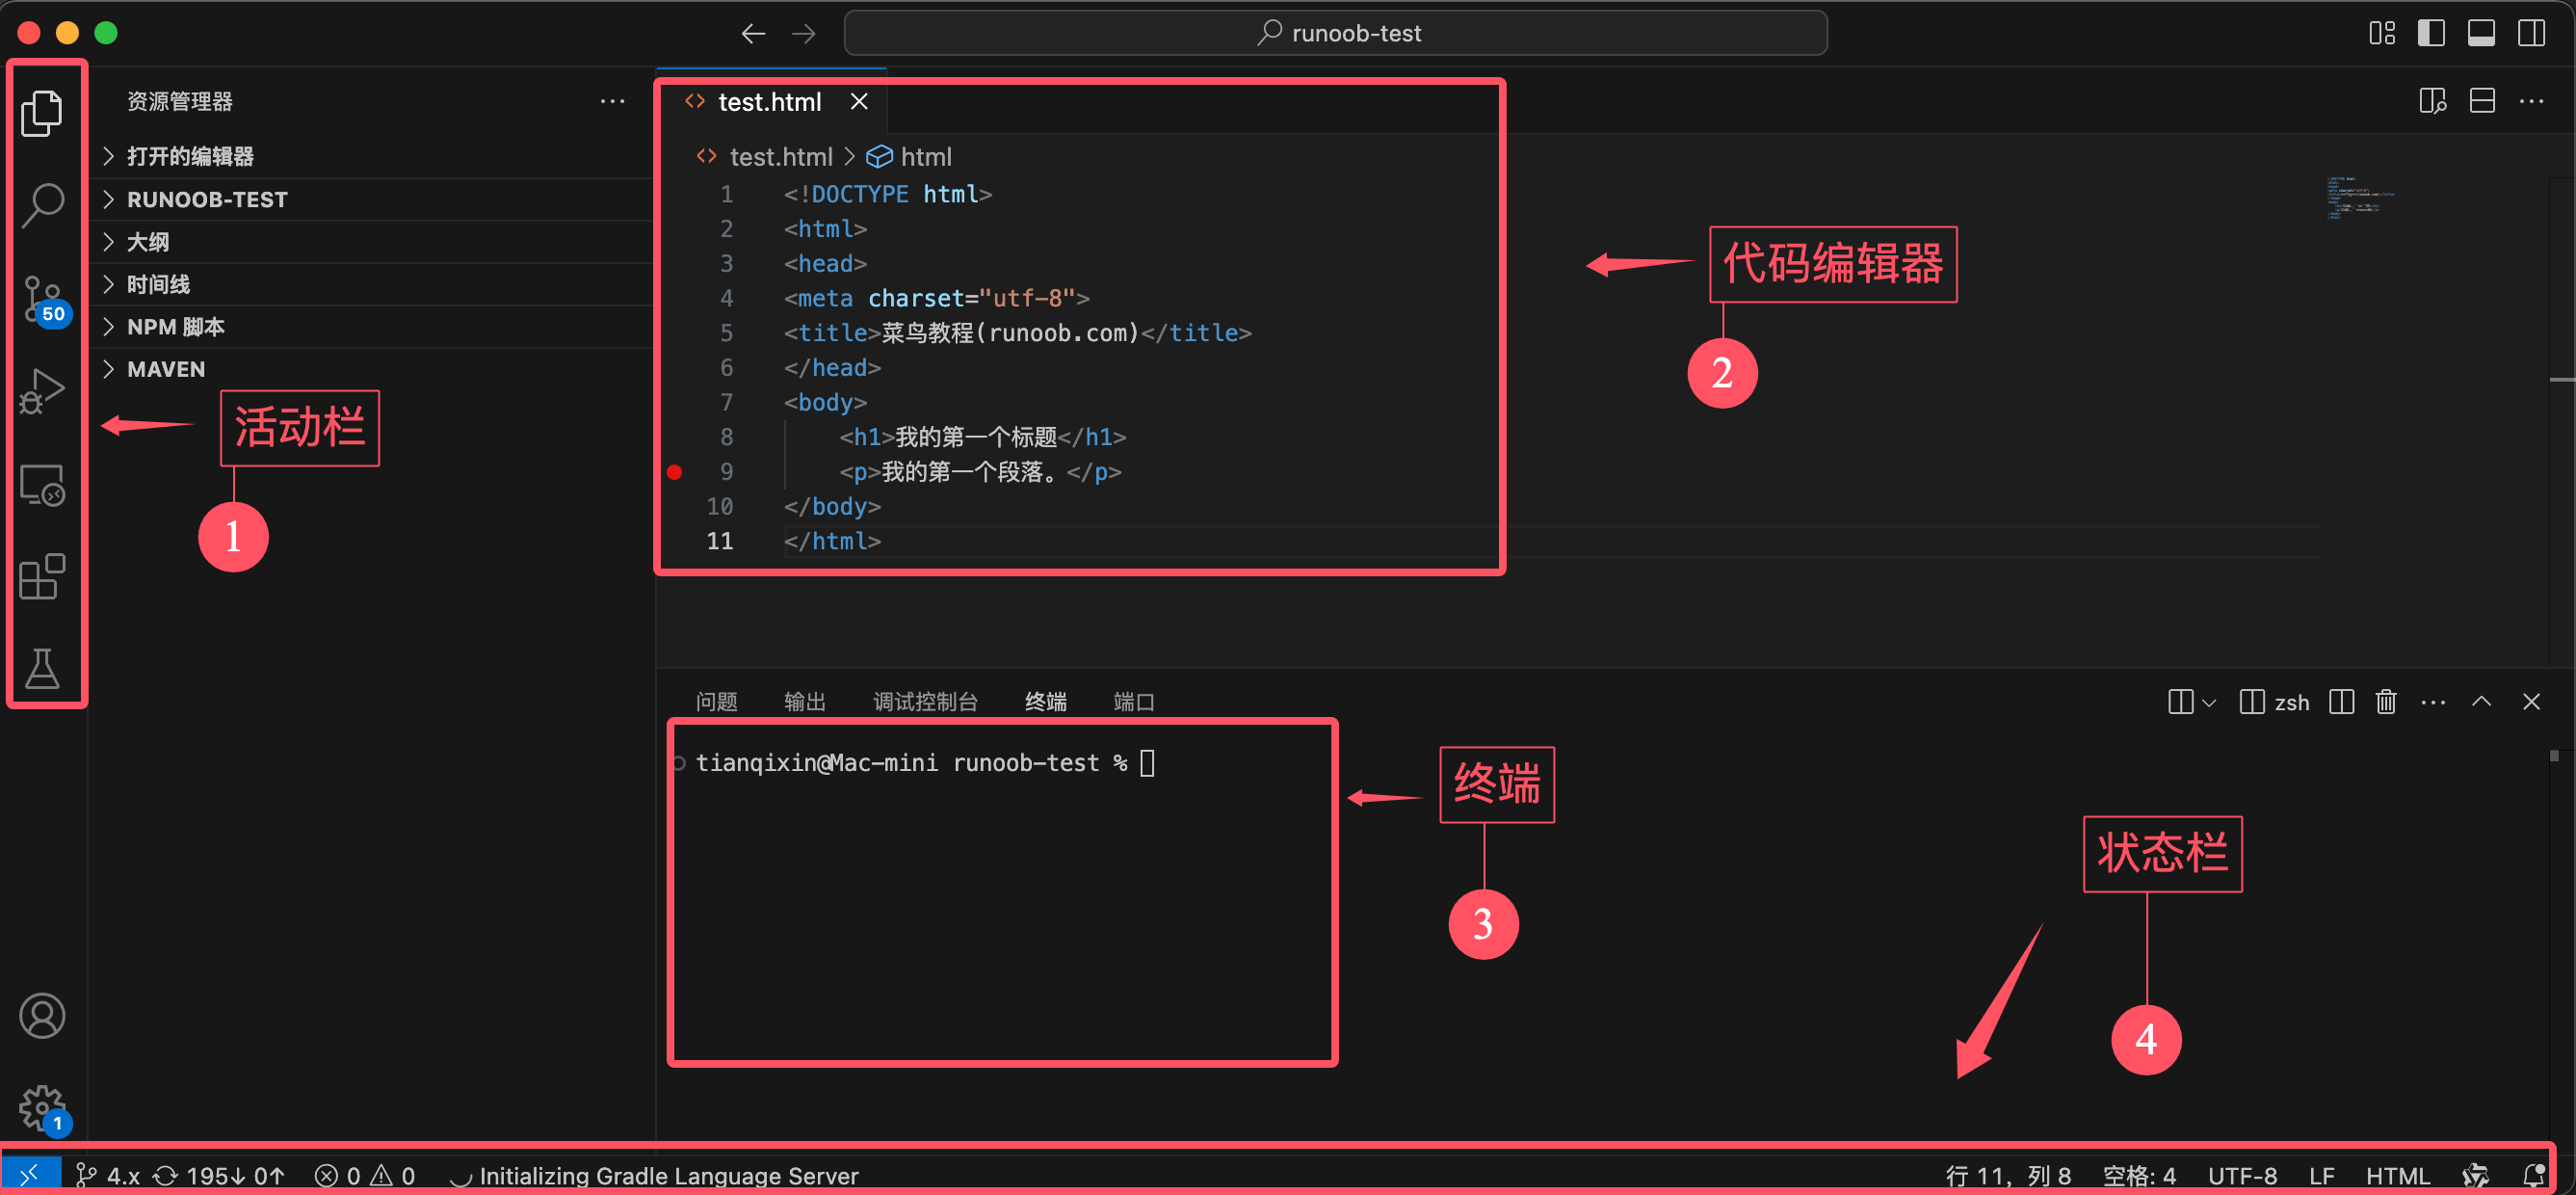
Activity Bar and Sidebar
On the left side of the interface, switch between different functional modules via icons:
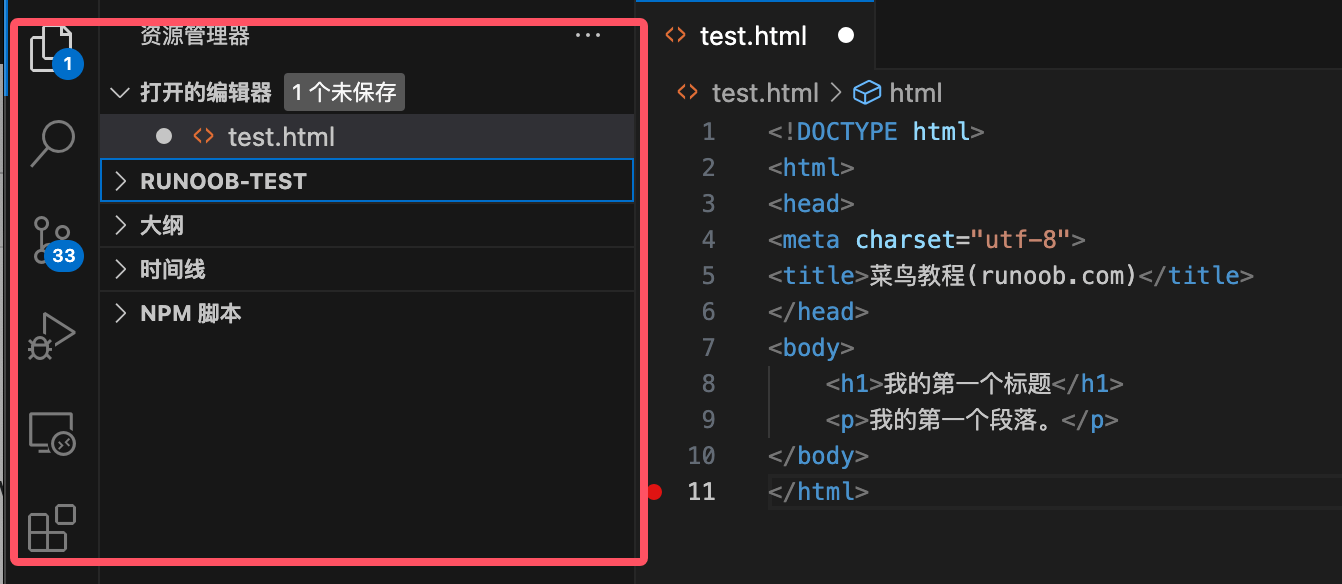
- Explorer (first icon): Shows the project file structure in the image, which includes:
EXAMPLE-TESTFolders: the project folder of the current workspace.test.htmlFiles: the HTML file currently being edited.
- Search (second icon): Used for global search of file content (inactive).
- Source Control (third icon): Displays Git status for easy code version management.
- Run and Debug (fourth icon): Allows setting breakpoints and running code.
- Extensions (fifth icon): Used to install and manage plugins.
Immediately to the right of the Activity Bar, the specific content of the current functional module is displayed:
- Currently displayed isExplorer。
- The project structure is clearly displayed, including:
EXAMPLE-TESTAll files in the folder.- The file currently being edited
test.html。
Editor Area
Located in the middle of the interface, used for displaying and editing file content:
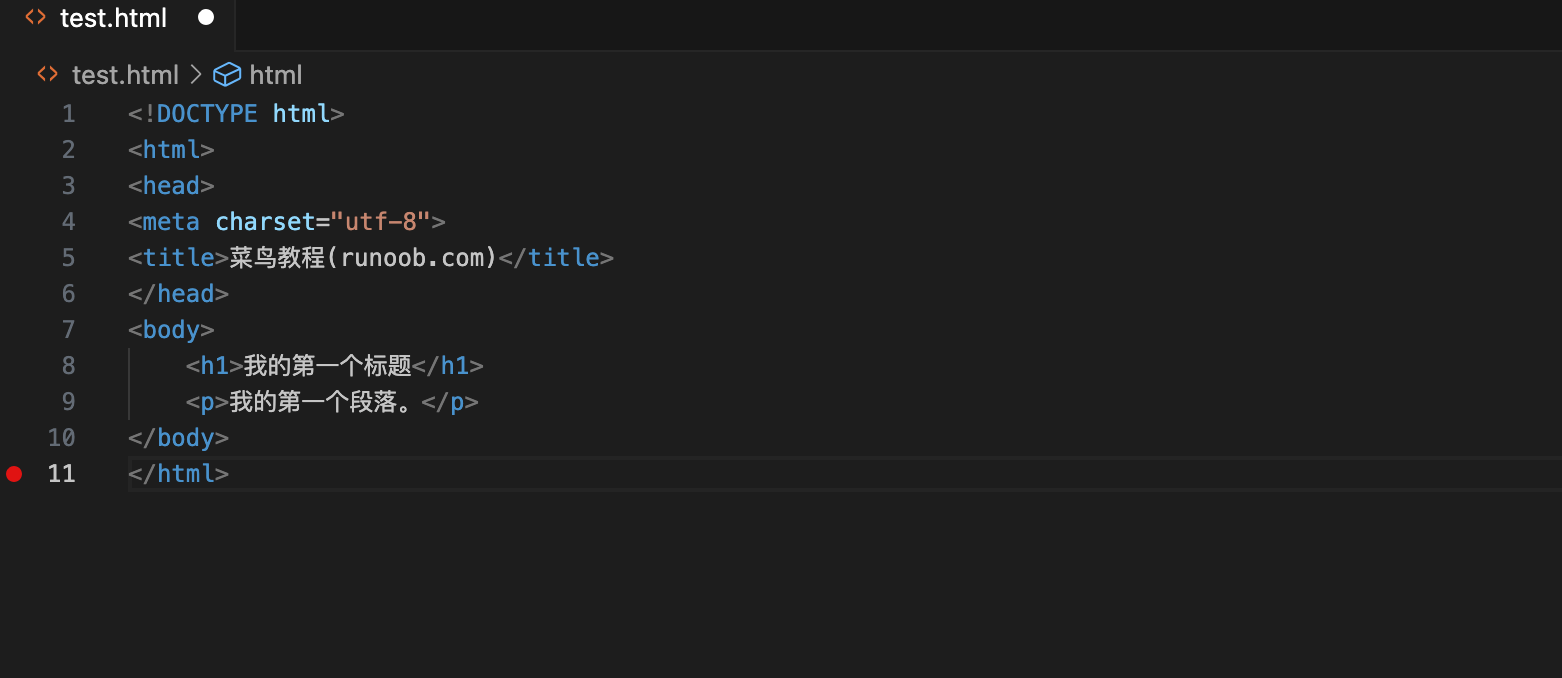
- The editor area displays
test.htmlThe code of the file. - Supports syntax highlighting (such as
DOCTYPE htmland<h1>tags). - The cursor is positioned on line 11 (the bottom status bar shows "Line 11").
Status Bar
Located at the bottom, displaying information about the current file and editing environment:
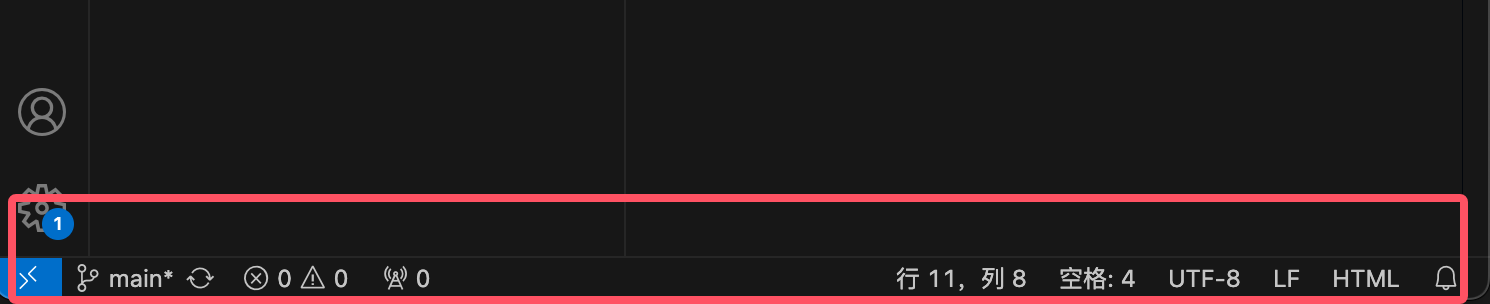
- Git Status: Current branch is
main(bottom left corner). - File Information:
- Encoding format: UTF-8.
- End-of-line sequence: LF.
- Current file type: HTML.
- Terminal Status: Shows the currently open terminal type as
zsh。