PyCharm Interface Guide
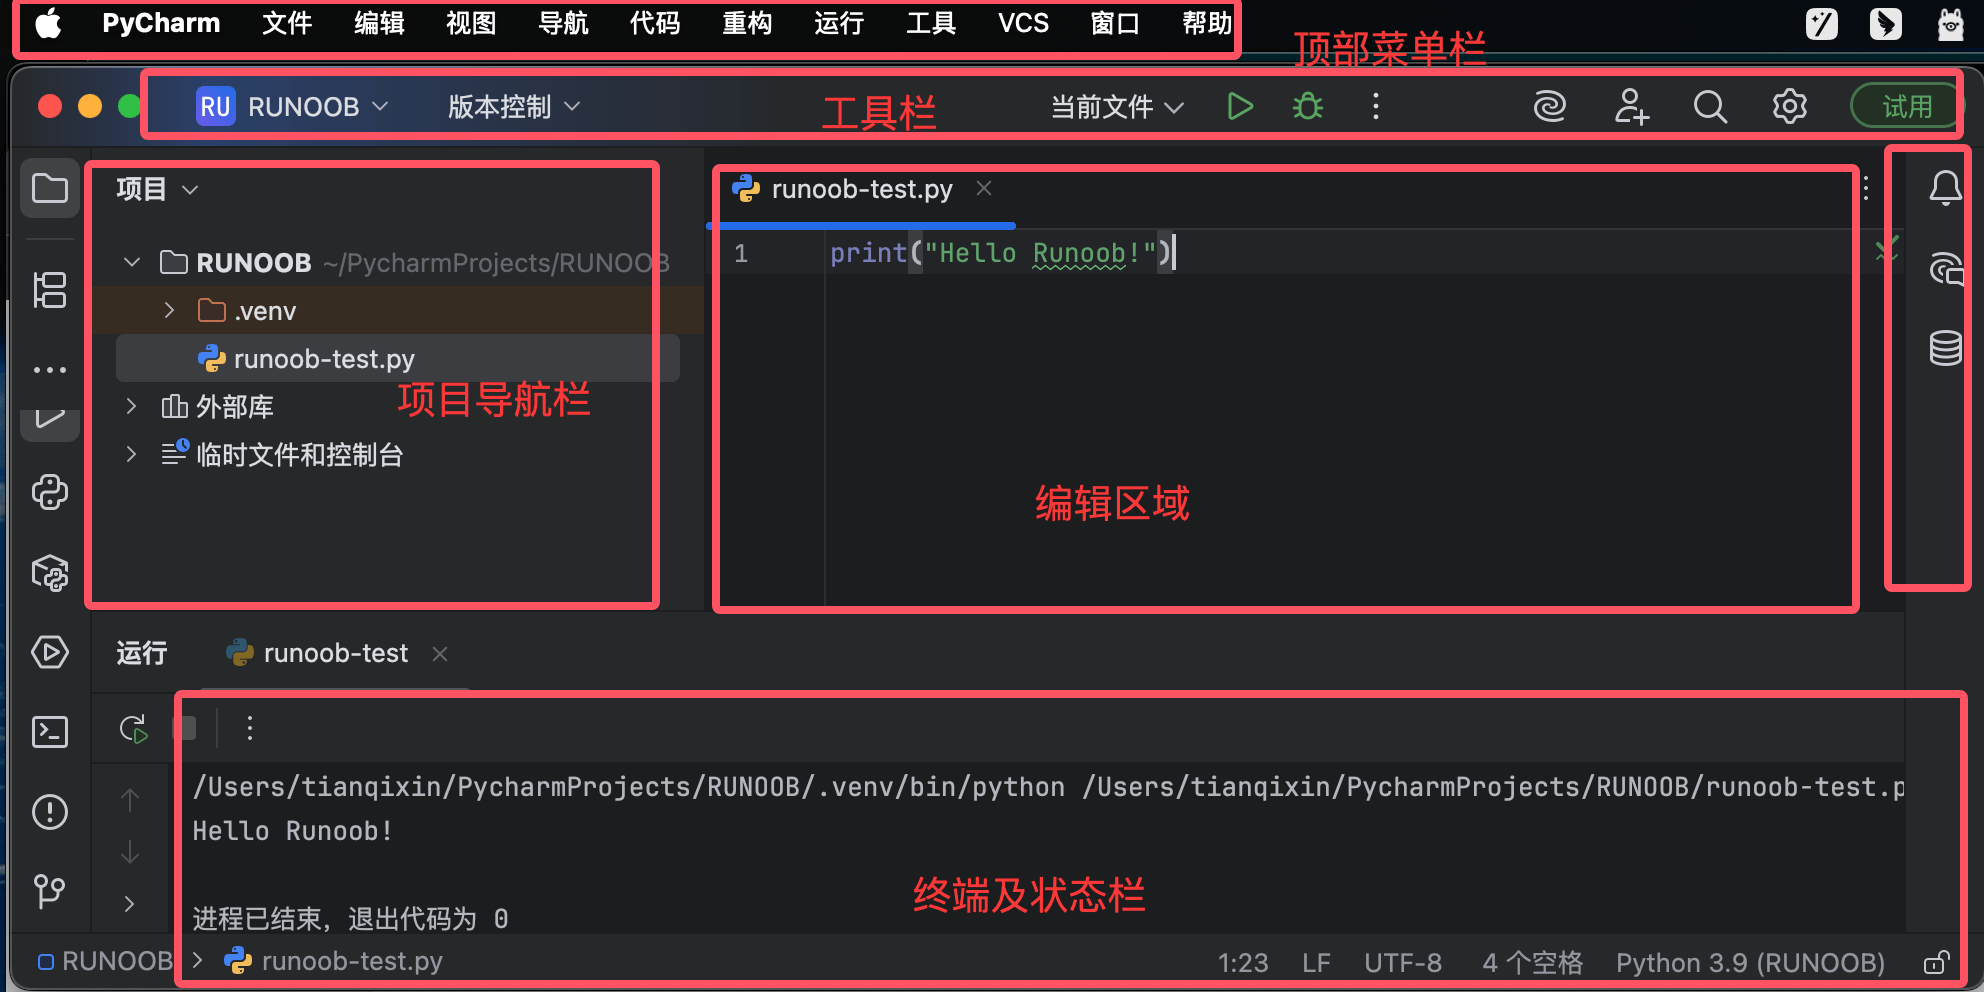
PyCharm's default interface is mainly divided into the following areas:
-
Top menu bar: File, Edit, View, Navigate, etc.
-
Toolbar: Quick buttons for common operations
-
Navigation bar: Simplified navigation showing the current file path
-
Side tool windows: Various functional panels on the left and right sides
-
Editor area: Central code editing area
-
Status bar: Displays project status information at the bottom
II. Detailed Explanation of Main Functional Areas
1. Top Menu Bar (Chinese-English Comparison)
-
File: Project/file operations (New, Open, Settings, etc.)
-
Edit: Code editing operations (Copy, Find, Code Generation, etc.)
-
View: Interface display control (Tool Windows, Appearance, etc.)
-
Navigate: Code navigation related features
-
Code: Code refactoring and generation
-
Refactor: Code refactoring functions
-
Run: Execution and debugging
-
Tools: Integrated tools (Database, Terminal, etc.)
-
Version Control (VCS): Version control such as Git
-
Window: Window layout management
-
Help: Documentation and support
2. Toolbar Icons (Common Functions)
-
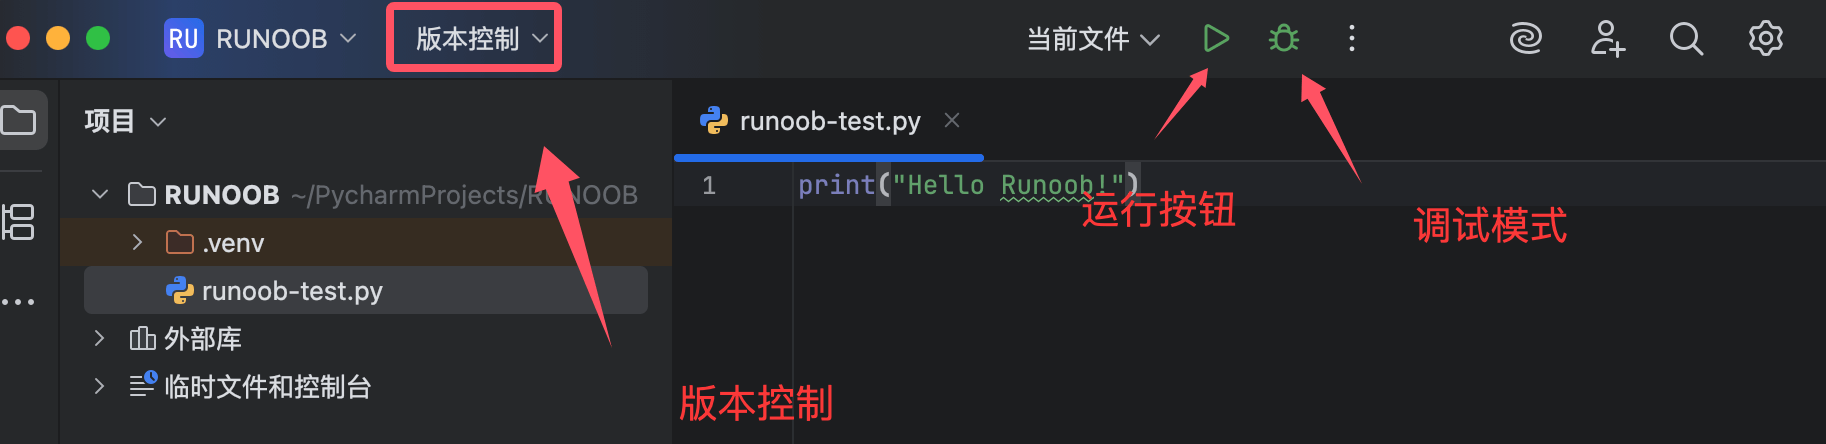
Run button: Runs the current project/script
-
Debug button: Starts in debug mode
-
Commit button: Version control commit
-
Update Project: Updates from VCS
-
History: Views local history
-
Settings: Opens the settings window
3. Left Tool Window
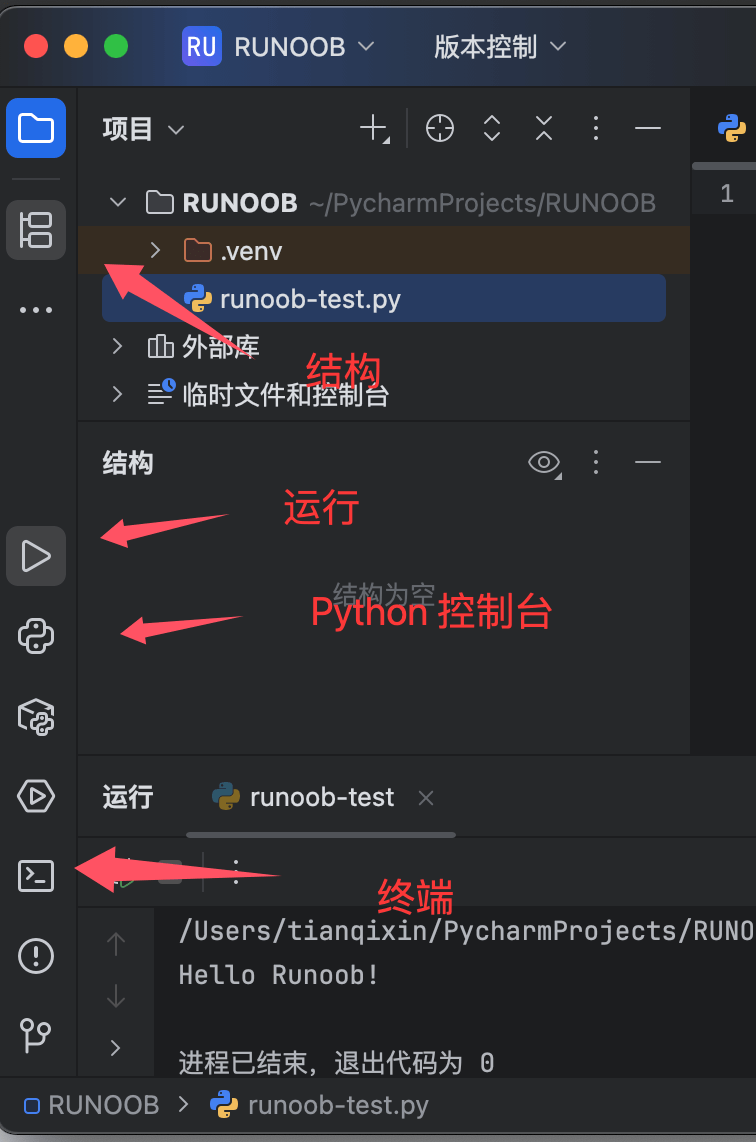
Project panel:
-
Displays the project directory structure
-
Right-click menu provides file operations
-
Supports file filtering and sorting
Structure panel:
-
Displays the code structure of the current file (classes, methods, etc.)
-
Allows quick navigation to specified elements
Python Console:
-
Interactive Python execution environment
-
Supports variable inspection and code snippet execution
Terminal:
-
System command-line terminal
-
Supports PowerShell/CMD/bash, etc.
4. Right Tool Window
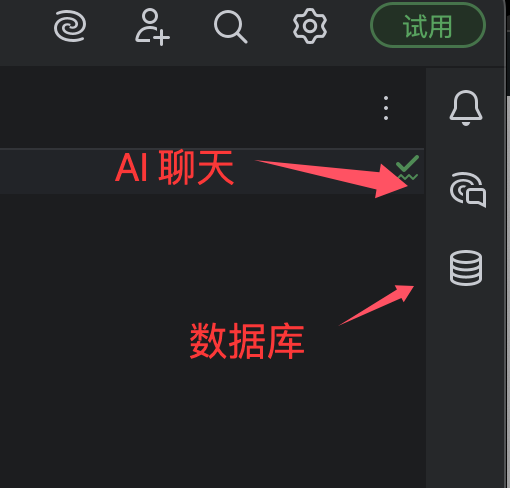
AI Chat:
-
AI chat window
Database:
-
Database connection management
-
SQL query execution and result viewing
5. Bottom Tool Window
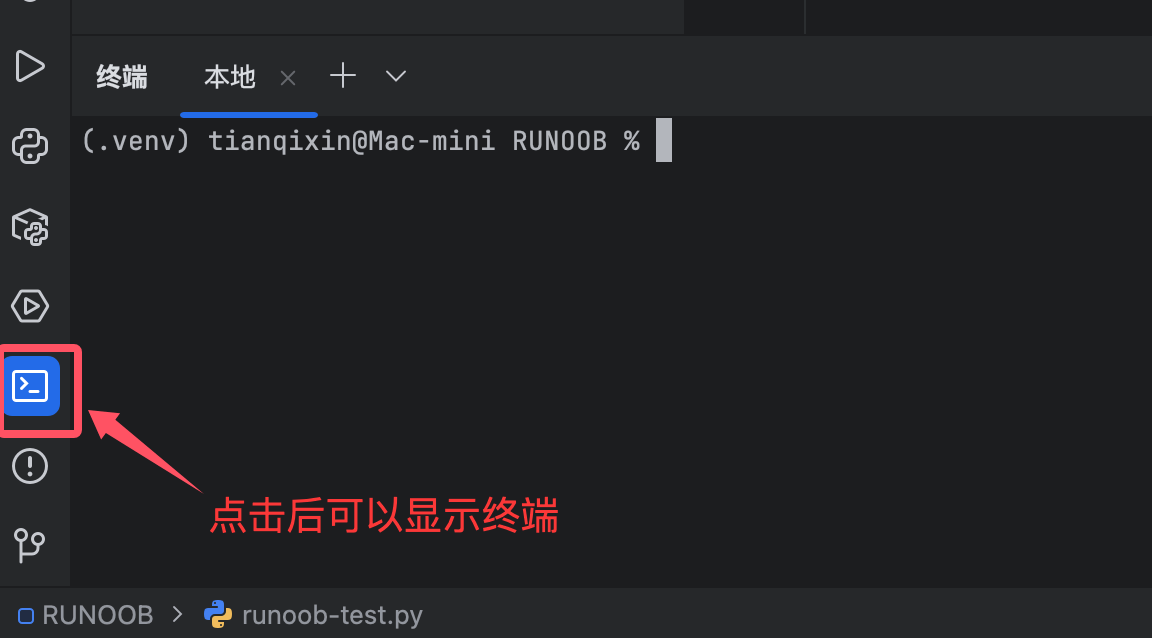
Run:
-
Program output display
-
Debug console
Problems:
-
Summary of code errors and warnings
-
Click to jump to the problematic code
TODO:
-
Collects TODO comments in the code
-
Displayed grouped by module
Version Control:
-
Version control operations such as Git
-
List of changed files
6. Editor Area
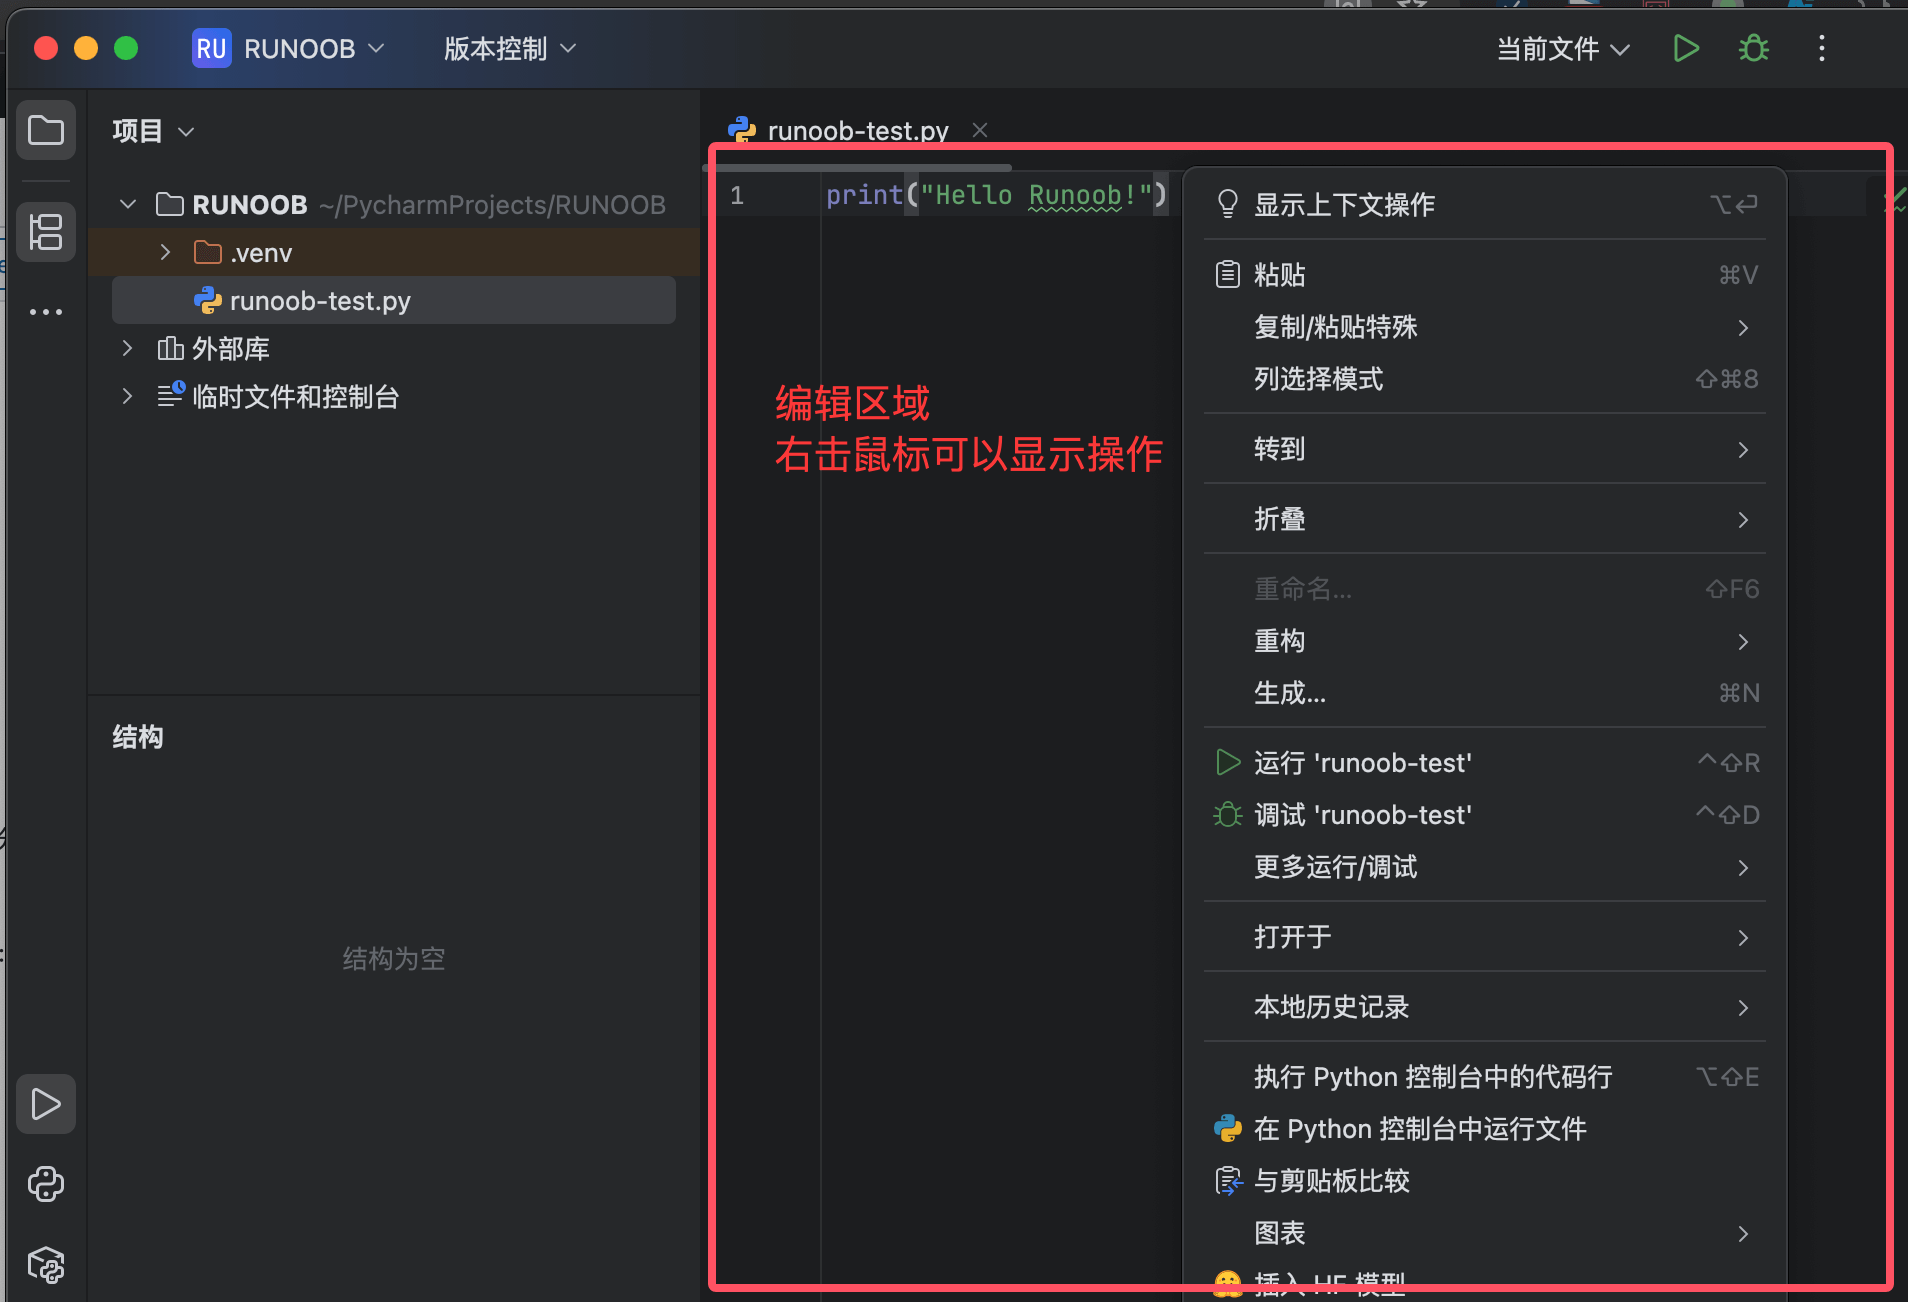
-
Tabs: Display opened files, support grouping
-
Code editing area: Main work area, supports:
-
Syntax highlighting
-
Code folding
-
Line number display
-
Error squiggly line hints
-
-
Right-side scroll bar: Displays code analysis markers (errors/warnings, etc.)
-
Gutter area: Displays breakpoints, bookmarks, etc.
7. Status Bar

-
Interpreter display: Currently used Python interpreter
-
Encoding format: File encoding (e.g., UTF-8)
-
Line endings: LF/CRLF
-
Cursor position: Line:Column indicator
-
Memory indicator: IDE memory usage
III. Interface Customization Tips
Adjusting the layout:
-
Drag the tool window title to dock/float it
-
Right-click the tool window title to set the display position
-
View → Tool Windows controls the display of each panel
Restore default layout:
-
Window → Restore Default Layout
Full screen mode:
-
View → Enter Full Screen
-
Or use the shortcut Ctrl+Shift+F12
Split-screen editing:
-
Right-click the editor tab → Split
-
Supports vertical/horizontal split screen
IV. Special Notes on the Chinese Interface
Terminology comparison:
-
"Refactor" → "Refactor" (Refactor)
-
"Inspect Code" → "Inspect Code" (Inspect Code)
-
"Run Configuration" → "Run Configuration" (Run Configuration)
Chinese input issuesIf the input method does not follow, you can try:
-
File → Settings → Appearance & Behavior → Appearance → Uncheck "Use native input method"
-
Or switch to a different input method
Chinese encoding settings:
-
File → Settings → Editor → File Encodings
-
It is recommended to set to UTF-8
-
You can enable "Transparent conversion" to handle existing files
V. Common View Modes
Focus mode:
-
View → Enter Distraction Free Mode
-
Hides all tool windows to focus on code editing
Presentation mode:
-
View → Enter Presentation Mode
-
Enlarges the code font, suitable for presentations
Full project view:
-
Double-press Shift → Search for "Project View"
-
Maximizes project structure browsing