Ollama GPU and Performance Optimization
If a model runs slowly, clues for nine out of ten causes can be found in a single line of ollama ps. This chapter moves from troubleshooting methods to hardware support and multi-GPU allocation, then to two advanced switches: Flash Attention and KV cache quantization.
There is only one goal: make the most of your GPU.
The first step is always: confirm where the model is running
The first action in performance troubleshooting is to look at the PROCESSOR column. It directly tells you where the model weights are loaded.
$ ollama ps
NAME             ID            SIZE      PROCESSOR    CONTEXT    UNTIL
qwen3.5:27b      a8b2c9d3e4f5  20.4GB    52%/48%      CPU/GPU    4 minutes from now
The three forms correspond to completely different situations:
| PROCESSOR shows | Meaning | Speed expectation |
|---|---|---|
| 100% GPU | All weights loaded into VRAM | Full GPU speed |
| 100% CPU | VRAM cannot hold it at all, pure memory inference | One to two orders of magnitude slower |
| 52%/48% CPU/GPU | Insufficient VRAM, weights are split | Noticeable drop, bottlenecked at cross-device transfer |
It's more intuitive to look at it together with generation speed: eval_count / eval_duration * 10^9 at the end of the API response gives you token/s (see the later part of the API chapter for usage). Use this number as the quantitative benchmark for each optimization.
When encountering a slow model, follow the decision path below:
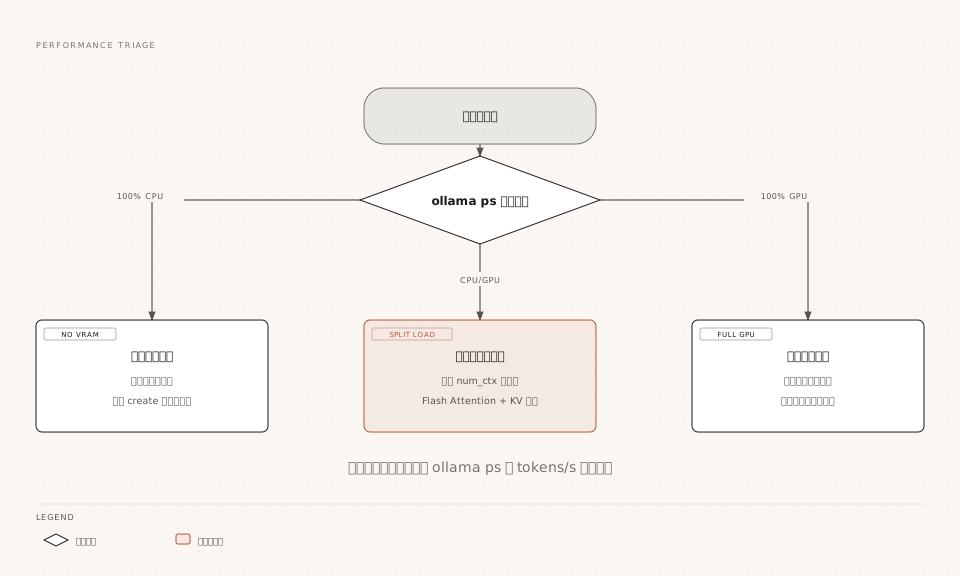
GPU acceleration support by platform
Ollama supports four major acceleration backends, and installing the correct driver is a prerequisite.
| Platform | Backend | Requirement |
|---|---|---|
| NVIDIA | CUDA | Compute capability 5.0+, driver 550+ (old cards with 5.0~6.2 require 570+) |
| AMD(Linux) | ROCm v7 | Requires ROCm v7 driver; old drivers may cause discovery timeout and fall back to CPU |
| AMD(Windows) | ROCm v7 / Vulkan | ROCm v7 or HIP7 driver stack; some RX 6000 series use Vulkan as a fallback |
| Apple Silicon | Metal | Works out of the box, no configuration needed |
| Intel / Others | Vulkan | Supplementary backend enabled by default, covering older AMD cards and Intel GPUs |
To troubleshoot whether the GPU is recognized, discovery records in the logs are the most convincing; NVIDIA users can also use docker run --gpus all ubuntu nvidia-smi to verify passthrough in container scenarios.
To restrict Ollama to only certain GPUs, or force pure CPU mode, each backend has corresponding switches:
Example
CUDA_VISIBLE_DEVICES=GPU-xxxx ollama serve
# AMD: similarly use the ROCr device list
ROCR_VISIBLE_DEVICES=0 ollama serve
# Vulkan: specify the device index
GGML_VK_VISIBLE_DEVICES=1 ollama serve
# For all three syntaxes, "-1" means disable GPU and force pure CPU
CUDA_VISIBLE_DEVICES=-1 ollama serve
Multi-GPU load distribution
The allocation strategy on multi-GPU machines is automatic, with only one rule: prefer a single GPU, and only split if it doesn't fit.
When the model can fit entirely into any single card, Ollama will choose one to load it—single-GPU avoids cross-PCIe data transfer and is usually the optimal throughput solution.
When a single GPU cannot fit the model, it is split across all available GPUs; at this point you also need to reserve headroom for KV cache and context. This is also a common reason why large-parameter models "get split even though the total VRAM seems sufficient."
When mixing multiple AMD GPUs on Linux, certain driver versions may produce garbled output. These issues are documented in AMD's official multi-GPU known issues documentation; prioritize upgrading the ROCm driver.
CPU inference optimization headroom
It can run without a discrete GPU, but there are several points worth squeezing out.
Ollama comes with multiple CPU inference libraries, with performance ranking: cpu_avx2 > cpu_avx > cpu. It is selected automatically by default; you can force-specify when auto-detection fails:
Example
OLLAMA_LLM_LIBRARY=cpu_avx2 ollama serve
# Confirm which instruction sets your CPU supports
cat /proc/cpuinfo | grep flags | head -1
Two additional facts: the macOS Rosetta translation environment can only use the basic cpu library; the thread count is controlled by num_thread in options, which defaults to the number of physical cores. Blindly increasing it can actually slow things down due to hyper-threading contention.
The hidden major factor in CPU inference is context length: with the same model, the CPU inference speed difference between 4K and 32K context is very significant. When configuring models for CPU scenarios, don't casually set num_ctx very large.
Flash Attention and KV cache quantization
These two are the most important VRAM optimizations for long-context scenarios. They target not model weights, but the KV cache that grows with context.
Newer versions of Ollama automatically enable Flash Attention when the backend supports it, and you can also force it on/off with environment variables:
Example
OLLAMA_FLASH_ATTENTION=1 ollama serve
# Quantize KV cache to 8-bit: VRAM halved, almost no precision loss (recommended)
OLLAMA_KV_CACHE_TYPE=q8_0 ollama serve
| KV cache type | VRAM usage | Quality impact | Recommendation |
|---|---|---|---|
| f16 (default) | Baseline | Lossless | Keep default when VRAM is abundant |
| q8_0 | About half | Almost imperceptible | Recommended choice for long-context scenarios |
| q4_0 | About a quarter | Perceptible under long context | Consider only when maximizing VRAM savings |
Two points to note: the KV cache type is a global configuration that applies to all loaded models; the impact of quantization on quality varies by model, and some models with high GQA structures are more sensitive. After switching, it's recommended to compare and verify using prompts with a fixed seed.
Quality trade-off between quantization precision and speed
The model selection chapter covered the size benefits of quantization; here we add several conclusions from a speed perspective.
| Precision | Size | Speed | Quality | Applicability |
|---|---|---|---|---|
| q8_0 | About half of fp16 | Close to fp16 | Almost lossless | Preferred choice when VRAM is abundant |
| q4_K_M | About a quarter of fp16 | Usually faster | Slight decrease | Default tier for local deployment |
| q4_K_S and lower | Smaller | Not necessarily faster | More noticeable decrease | Extreme VRAM savings |
A counterintuitive point: lower quantization is not necessarily faster. Inference speed is constrained by memory bandwidth, and some low-bit formats require additional dequantization computation. In practice, they may be the same or even slower. Don't just look at the numbers when choosing a quantization tier.
Recommended comparison method: fix the seed and use the same set of prompts, compare the output and token/s of two quantization tiers at a temperature of 0.3, looking at quality and speed together.
Concurrency and throughput tuning
After single-request optimization reaches its limit, the next step is to make the service handle concurrency.
The core variable is OLLAMA_NUM_PARALLEL (number of parallel requests per model). The cost must be kept in mind: parallel processing multiplies the context cache, and the required VRAM is approximately equal to that value multiplied by the KV space for the context length. Setting it too large may evict the model from the GPU.
Server-side queueing is controlled by OLLAMA_MAX_QUEUE, default 512. Exceeding it returns 503 directly, and the client needs to retry.
The operational order for throughput tuning:
Step 1: single-request tuning (specs, quantization, FA and KV cache) to confirm single-stream speed.
Step 2: gradually increase NUM_PARALLEL, and at each level use ollama ps to confirm it's still 100% GPU, observing whether total throughput rises.
Step 3: when 503 queueing or mixed splitting appears, step back one level—that's the VRAM red line.
Other extensions