Linux journalctl Command
 Linux Command Reference
What is journalctl?
journalctl is a powerful tool in Linux for querying and displaying systemd logs. As part of the systemd ecosystem, it provides centralized log management, replacing the traditional syslog service.
Core Features
- Binary log storage: Logs are stored in binary format to improve retrieval efficiency.
- Structured logs: Supports attaching metadata and structured log fields.
- Real-time monitoring: Can track log changes in real time.
- Multiple filtering methods: Supports filtering by time, service, priority, and many other conditions.
Basic Syntax
The basic command format for journalctl is as follows:
journalctl [选项] [匹配条件...]
Common Options Overview
| Option | Description |
|---|---|
-b |
Display logs from the current boot |
-f |
Follow logs (similar to tail -f) |
-k |
Show only kernel messages |
-u |
Show logs for a specified unit |
-n |
Show the most recent n log entries |
--since |
Show logs after a specified time |
--until |
Show logs before a specified time |
Common Usage Examples
1. View Full System Logs
Example
journalctl
2. View Logs for the Current Boot
Example
journalctl -b
3. Monitor New Logs in Real Time
Example
journalctl -f
4. View Logs for a Specific Service
Example
journalctl -u nginx.service
5. Query by Time Range
Example
journalctl --since "2023-01-01 00:00:00" --until "2023-01-02 12:00:00"
6. View Error-Level Logs
Example
journalctl -p err
Log Priority Filtering
journalctl supports filtering by log priority. The priorities are defined as follows:
| Priority | Value | Description |
|---|---|---|
| emerg | 0 | Emergency |
| alert | 1 | Requires immediate handling |
| crit | 2 | Critical |
| err | 3 | Error |
| warning | 4 | Warning |
| notice | 5 | Notice |
| info | 6 | Informational |
| debug | 7 | Debug |
Usage examples:
Example
# Display logs at error level and above
journalctl -p err
# Display logs at warning level and above
journalctl -p warning
journalctl -p err
# Display logs at warning level and above
journalctl -p warning
Advanced Usage
1. Show Disk Space Used by Logs
Example
journalctl --disk-usage
2. Clean Up Old Logs
Example
# Keep logs from the last 2 days
journalctl --vacuum-time=2d
# Limit maximum log usage to 500MB
journalctl --vacuum-size=500M
journalctl --vacuum-time=2d
# Limit maximum log usage to 500MB
journalctl --vacuum-size=500M
3. Output in JSON Format
Example
journalctl -o json
4. Display Complete Field Information
Example
journalctl -o verbose
5. Filter by Specific Field
Example
# Display logs for a specific process ID
journalctl _PID=1234
# Display logs for a specific user
journalctl _UID=1000
journalctl _PID=1234
# Display logs for a specific user
journalctl _UID=1000
Practical Tips
1. Combined Queries
Example
# Query error logs for the nginx service since yesterday
journalctl -u nginx.service --since yesterday -p err
journalctl -u nginx.service --since yesterday -p err
2. View with Paging
Example
journalctl | less
3. Export Logs to File
Example
journalctl --since "2023-01-01" > journal.log
4. View Kernel Ring Buffer Messages
Example
journalctl -k
5. View System Boot Process Logs
Example
journalctl -b0 | grep "Starting"
Common Problem Solutions
Issue 1: Incomplete Log Display
Solution:
Example
# Increase the output line limit
journalctl --no-pager
journalctl --no-pager
Issue 2: How to View Rotated Old Logs?
Solution:
Example
# View all logs (including archived ones)
journalctl -a
journalctl -a
Issue 3: How to View Logs at a Specific Time Point?
Solution:
Example
# Time query accurate to the second
journalctl --since "2023-01-01 12:00:00" --until "2023-01-01 12:05:00"
journalctl --since "2023-01-01 12:00:00" --until "2023-01-01 12:05:00"
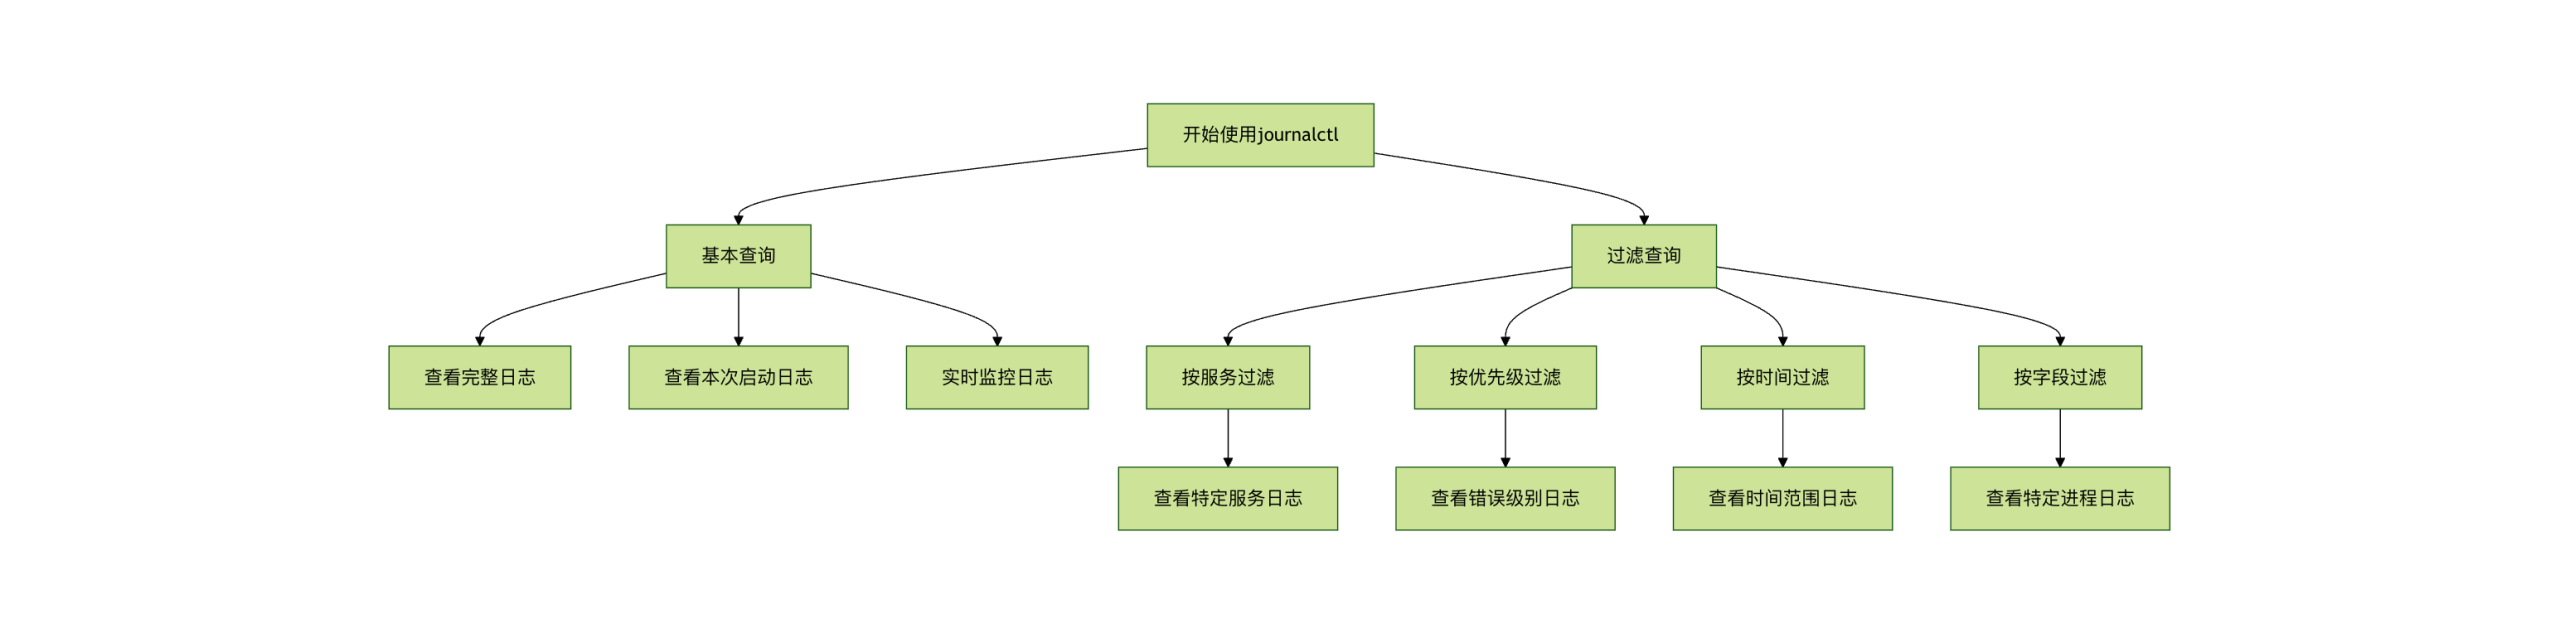
Summary Flowchart