ASP.NET Web Pages - Chart Helper
Chart Helper - One of the many useful ASP.NET Web Helpers.
Chart Helper
In the previous chapters, you have learned how to use ASP.NET "Helpers".
Earlier, it was introduced how to use the "WebGrid Helper" to display data in a grid.
This chapter introduces how to use the "Chart Helper" to display data in a graphical form.
The "Chart Helper" can create chart images of different types with many formatting options and labels. It can create standard charts like area charts, bar charts, column charts, line charts, pie charts, as well as more specialized charts like stock charts.
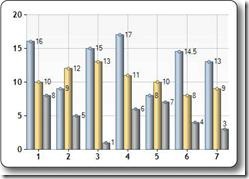
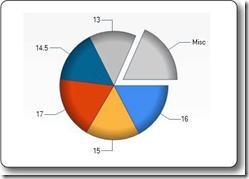
The data displayed in a chart can be from an array, a database, or a file.
Creating Charts from Arrays
The following example shows the code required to display a chart based on array data:
Example
var myChart = new Chart(width: 600, height: 400)
.AddTitle("Employees")
.AddSeries(chartType: "column",
xValue: new[] { "Peter", "Andrew", "Julie", "Mary", "Dave" },
yValues: new[] { "2", "6", "4", "5", "3" })
.Write();
}
Run example »
- new ChartCreate a new chart object and set its width and height
- AddTitleMethod specifies the title of the chart
- AddSeriesMethod adds data to the chart
- chartTypeParameter defines the chart type
- xValueParameter defines the x-axis name
- yValuesParameter defines the y-axis name
- Write()Method displays the chart
Creating Charts from a Database
You can execute a database query, and then use the data from the query results to create a chart:
Example
var db = Database.Open("SmallBakery");
var dbdata = db.Query("SELECT Name, Price FROM Product");
var myChart = new Chart(width: 600, height: 400)
.AddTitle("Product Sales")
.DataBindTable(dataSource: dbdata, xField: "Name")
.Write();
}
Run example »
- var db = Database.OpenOpen the database (assign the database object to variable db)
- var dbdata = db.QueryExecute the database query and save the result in dbdata
- new ChartCreate a new chart object and set its width and height
- AddTitleMethod specifies the title of the chart
- DataBindTableMethod binds the data source to the chart
- Write()Method displays the chart
Besides using the DataBindTable method, another approach is to use AddSeries (see the previous example). DataBindTable is easier to use, but AddSeries is more flexible because you can specify the chart and data more explicitly:
Example
var db = Database.Open("SmallBakery");
var dbdata = db.Query("SELECT Name, Price FROM Product");
var myChart = new Chart(width: 600, height: 400)
.AddTitle("Product Sales")
.AddSeries(chartType:"Pie",
xValue: dbdata, xField: "Name",
yValues: dbdata, yFields: "Price")
.Write();
}
Run example »
Creating Charts from XML Data
A third way to create charts is to use an XML file as the data for the chart:
Example
@{
var dataSet = new DataSet();
dataSet.ReadXmlSchema(Server.MapPath("data.xsd"));
dataSet.ReadXml(Server.MapPath("data.xml"));
var dataView = new DataView(dataSet.Tables[0]);
var myChart = new Chart(width: 600, height: 400)
.AddTitle("Sales Per Employee")
.AddSeries("Default", chartType: "Pie",
xValue: dataView, xField: "Name",
yValues: dataView, yFields: "Sales")
.Write();}
}
Run example »