Playwright VS Code Development Environment Setup
For Playwright development, it is recommended to useVS Code, because it offers powerful support for JavaScript/TypeScript, the debugger, and extensions.
Install VS Code
- Go tothe VS Code official websiteDownload and install.
- After installation, it is recommended to also installthe Chinese Language Pack(search in the Extensions Marketplace
Chinese (Simplified))。
VS Code related references:https://www.example.com/vscode/vscode-tutorial.html
Essential Extensions
In the VS Code Extensions panel, search for and install the following extensions:
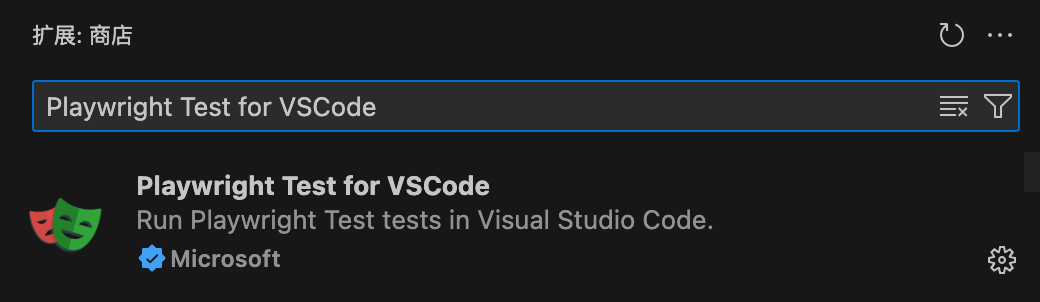
Playwright Test for VSCode
- The official Playwright extension
- Features: run/debug tests, view test reports, record scripts, generate trace
- Extension ID:
ms-playwright.playwright
JavaScript / TypeScript support(Built into VS Code, usually no need to install separately)
Recommended (optional):
- ESLint(To ensure consistent code style)
- Prettier - Code formatter(One-click code formatting)
Initialize a Playwright Project
If you haven't initialized a project yet, first run:
npm init playwright@lates
The VS Code extension will automatically detect the project'splaywright.config.ts/js, and enable the Test View.
VS Code Settings
Open VS Code Settings (shortcut keyCtrl+,orCmd+,), and confirm the following settings:
-
Format on Save
Search forformat on save→ CheckEditor: Format On Save -
Default Terminal Shell(Choose according to your system)
Windows recommended:PowerShellorGit Bash
macOS/Linux default is fine
Debug Configuration (launch.json)
In VS Code, click on the left sidebarRun and Debug→ Create configuration, selectNode.js, generate.vscode/launch.json, add a Playwright debug configuration, for example:
{
  "version": "0.2.0",
  "configurations": [
    {
      "name": "Debug Playwright Test",
      "type": "node",
      "request": "launch",
      "program": "${workspaceFolder}/node_modules/.bin/playwright",
      "args": ["test", "--project=chromium", "--headed"],
      "console": "integratedTerminal",
      "internalConsoleOptions": "neverOpen"
    }
  ]
}
This way, in VS Code you can pressF5to start debugging, and Playwright will run in headed mode for easy observation.
Using the Playwright Extension Panel
After installing thePlaywright Test for VSCodeextension, a "Playwright" icon will appear on the left:
- You can directly see the test files and test case list in the project.
- Click the ▶ button to the right of a test case to run it.
- Right-click and selectDebug Testto debug step by step.
- For failed tests, you can directly viewtrace files.
Common Commands
Run in the VS Code terminal:
npx playwright test           # 运行全部测试
npx playwright test login.spec.js # 运行指定文件
npx playwright codegen        # 启动录制工具(自动生成脚本)
npx playwright show-report    # 打开测试报告
Testing Sidebar
After installing the extension, a Testing icon (a laboratory beaker icon) will appear on the left side of VS Code.
Click to enter the Testing Sidebar, and you can see a list of all test files.
Here you can:
- Expand a file to view each
describeandtest - Click the play button to run a single test or all tests.
- View test execution status in real time (green for passed, red for failed, gray for skipped).
- Right-click a test to access more options (debug, go to definition, etc.).
Debug Mode
The VS Code extension lets you debug Playwright tests just like debugging normal code:
Setting Breakpoints
Click to the left of the line number in the code to add a red breakpoint.
Right-click next to the breakpoint and selectDebug Test, and the test will pause at the breakpoint.
Debugging Features
- Step Over (F10), Step Into (F11), Step Out (Shift+F11)
- View current variable values
- View the call stack
- Evaluate expressions in the Debug Console
Live Debugging
Live Debugging is a unique feature of the VS Code extension.
EnableShow BrowserWhen running tests with this option, click a Locator in the code, and the corresponding page element will be highlighted in the browser window.
If a Locator matches multiple elements, Playwright will highlight all matching elements at the same time.
You can edit the Locator directly in the code, and the browser will display the updated matching results in real time.
Pick Locator
At the bottom of the Testing Sidebar, click thePick Locatorbutton.
In the browser that pops up, click the target element, and VS Code'sPick Locatorbox will display the best locator.
Press Enter to copy to the clipboard, then paste it into the test code.
Playwright will automatically choose the most stable and semantic locator (priority: role > text > testid).
Record New Test
In the Testing Sidebar, click theRecord newbutton.
Playwright will open a browser window, and all your actions in it (navigation, clicks, input) will be recorded.
You can also generate assertions via the toolbar:
- Assert visibility— assert element is visible
- Assert text— assert element contains text
- Assert value— assert element's value
After recording is complete, close the browser, and the code will be automatically generated in thetest-1.spec.tsfile.
Record at Cursor
In existing test code, place the cursor where you want to insert actions, and clickRecord at cursor。
Playwright will record subsequent actions in the browser and insert the generated code at the cursor position.
This feature is ideal for adding steps to an existing test.
Other Extensions