Python Quantitative Data Visualization
Python quantitative data visualization can useMatplotlibandSeabornlibraries.
To install Matplotlib and Seaborn, run the following in the terminal or command prompt:
pip install matplotlib seaborn
For detailed content on Matplotlib, you can refer to:Matplotlib Tutorial
This chapter mainly introduces the use of the Seaborn library.
Seaborn Library
Seaborn is a data visualization library based on Matplotlib, focused on drawing statistical graphics.
Seaborn provides high-level interfaces and color themes, making it easier to create beautiful statistical charts in Python.
Seaborn's goal is to make data visualization simpler while also making charts more attractive.
1. Simple Creation of Statistical Graphics
Seaborn provides a series of built-in plotting functions that allow you to easily create various statistical graphics, such as scatter plots, histograms, box plots, etc.
Example
import matplotlib.pyplot as plt
# Create scatter plot
sns.scatterplot(x='sepal_length', y='sepal_width', data=iris)
plt.show()
2. Built-in Color Themes
Seaborn provides built-in color themes that make it easy to change the appearance of charts and make them more attractive.
# 使用 Seaborn 颜色主题
sns.set(style="whitegrid")
3. Dataset Visualization
Seaborn includes several built-in datasets that can be used directly for plotting, for example, the tips and flights datasets.
# 使用内置数据集
tips = sns.load_dataset("tips")
4. Visualization of Categorical Data
Seaborn is very convenient for handling categorical data, allowing you to easily create grouped bar charts, box plots, etc.
# 创建分组柱状图
sns.barplot(x="day", y="total_bill", hue="sex", data=tips)
5. Visualization of Matrix Data
Seaborn provides functions specifically for visualizing matrix data, such as heatmaps.
# 创建热力图
corr_matrix = df.corr()
sns.heatmap(corr_matrix, annot=True, cmap="coolwarm")
6. Facet Plotting
Seaborn supports facet plotting, which creates multiple small plots based on data subsets to display data more comprehensively.
# 分面绘图
sns.relplot(x="total_bill", y="tip", hue="day", col="time", data=tips)
Seaborn provides a large number of plotting options and parameters to meet different types of data visualization needs.
Overall, Seaborn is a powerful and easy-to-use library, suitable for beginners and professional data scientists alike, helping users create attractive statistical charts more easily. If you are already familiar with Matplotlib, Seaborn is a great complement that allows you to perform data visualization more efficiently.
Example
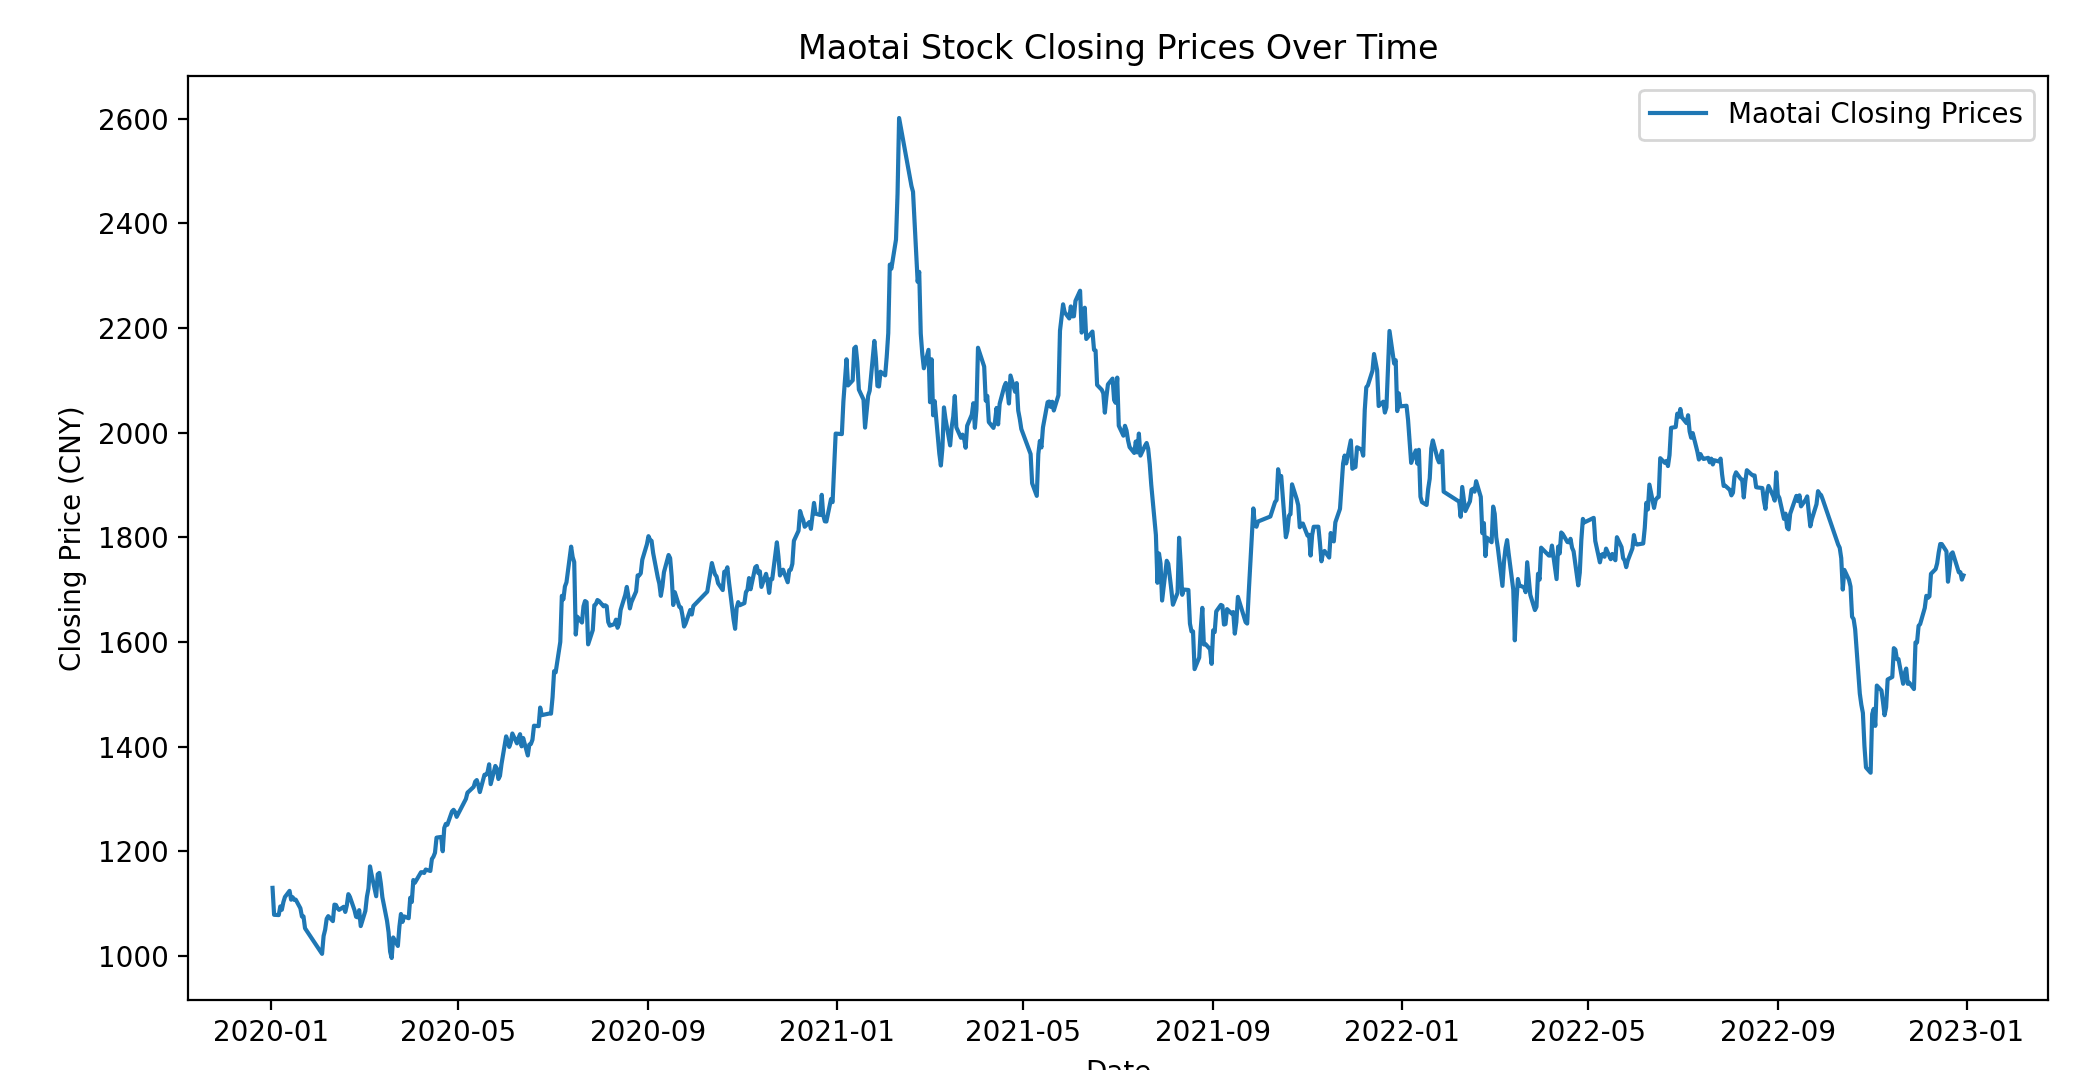
Next, we use Python for a simple quantitative example. You can use yfinance to fetch stock data for Guizhou Moutai (600519.SS), and then use seaborn for data visualization.
The following is a simple example that demonstrates how to download Moutai stock data and use seaborn to plot the closing price trend chart:
Example
import seaborn as sns
import matplotlib.pyplot as plt
# Get stock data for Guizhou Moutai
maotai_data = yf.download("600519.SS", start="2020-01-01", end="2023-01-01")
# Select closing price data
closing_prices = maotai_data['Close']
# Use seaborn to plot the trend chart
plt.figure(figsize=(12, 6))
sns.lineplot(x=closing_prices.index, y=closing_prices.values, label='Maotai Closing Prices')
plt.title('Maotai Stock Closing Prices Over Time')
plt.xlabel('Date')
plt.ylabel('Closing Price (CNY)')
plt.legend()
plt.show()
Execute the above code, and the output result is: