Python Quantitative Stock K-line Chart
We can usePython pyecharts moduleto draw stock K-line charts.
pyecharts is a Python data visualization library based on ECharts. It allows users to use Python to generate various types of interactive charts and data visualizations.
View the Python pyecharts module content:Python pyecharts module。
In pyecharts, you can use the K-line chart (Kline) to display stock trends. K-line charts are mainly used to display financial data, such as a stock's opening price, closing price, highest price, and lowest price.
First, make sure you have installed pyecharts:
pip install pyecharts
We use data from Yahoo Finance to obtain the stock data of the past year. We can use the yfinance library:
pip install yfinance
K-line Chart Usage
Import the relevant modules:
from pyecharts import options as opts
from pyecharts.charts import Kline
Prepare the data:
Kline chart data is usually a two-dimensional array containing the opening price, closing price, highest price, and lowest price, for example:
data = [
    [2320.26, 2320.26, 2287.3, 2362.94],
    [2300, 2291.3, 2288.26, 2308.38],
    # ...
]
Configure the Kline chart:
kline = (
    Kline()
    .add_xaxis(xaxis_data=["2017-10-24", "2017-10-25", "2017-10-26", "2017-10-27"])
    .add_yaxis(series_name="Kline", y_axis=data)
    .set_global_opts(
        xaxis_opts=opts.AxisOpts(is_scale=True),
        yaxis_opts=opts.AxisOpts(is_scale=True),
        title_opts=opts.TitleOpts(title="Kline 示例"),
    )
)
Here, add_xaxis is used to set the x-axis data, add_yaxis is used to add the Kline data series, and set_global_opts is used to set global configurations, including the title, etc.
Render the chart:
kline.render("kline_chart.html")Render the Kline chart to an HTML file.
Example
from pyecharts.charts import Kline
# Prepare the data
data = [
[2320.26, 2320.26, 2287.3, 2362.94],
[2300, 2291.3, 2288.26, 2308.38],
[2295.35, 2346.5, 2295.35, 2345.92],
[2347.22, 2358.98, 2337.35, 2363.8],
# ... more data
]
# Configure the Kline chart
kline = (
Kline()
.add_xaxis(xaxis_data=["2017-10-24", "2017-10-25", "2017-10-26", "2017-10-27"])
.add_yaxis(series_name="Kline", y_axis=data)
.set_global_opts(
xaxis_opts=opts.AxisOpts(is_scale=True),
yaxis_opts=opts.AxisOpts(is_scale=True),
title_opts=opts.TitleOpts(title="Kline Example"),
)
)
# Render the chart
kline.render("kline_chart.html")
Explanation:
- We have a dataset named
data, which contains daily financial data, including the opening price, closing price, highest price, and lowest price. - We created a
Klineinstance, usedadd_xaxisto set the x-axis data (in this case, the dates), and usedadd_yaxisto add the Kline data series. - Use
set_global_optsto set global options, such as x-axis and y-axis zoom, and the chart title. - Finally, we use
renderto render the chart to an HTML file.
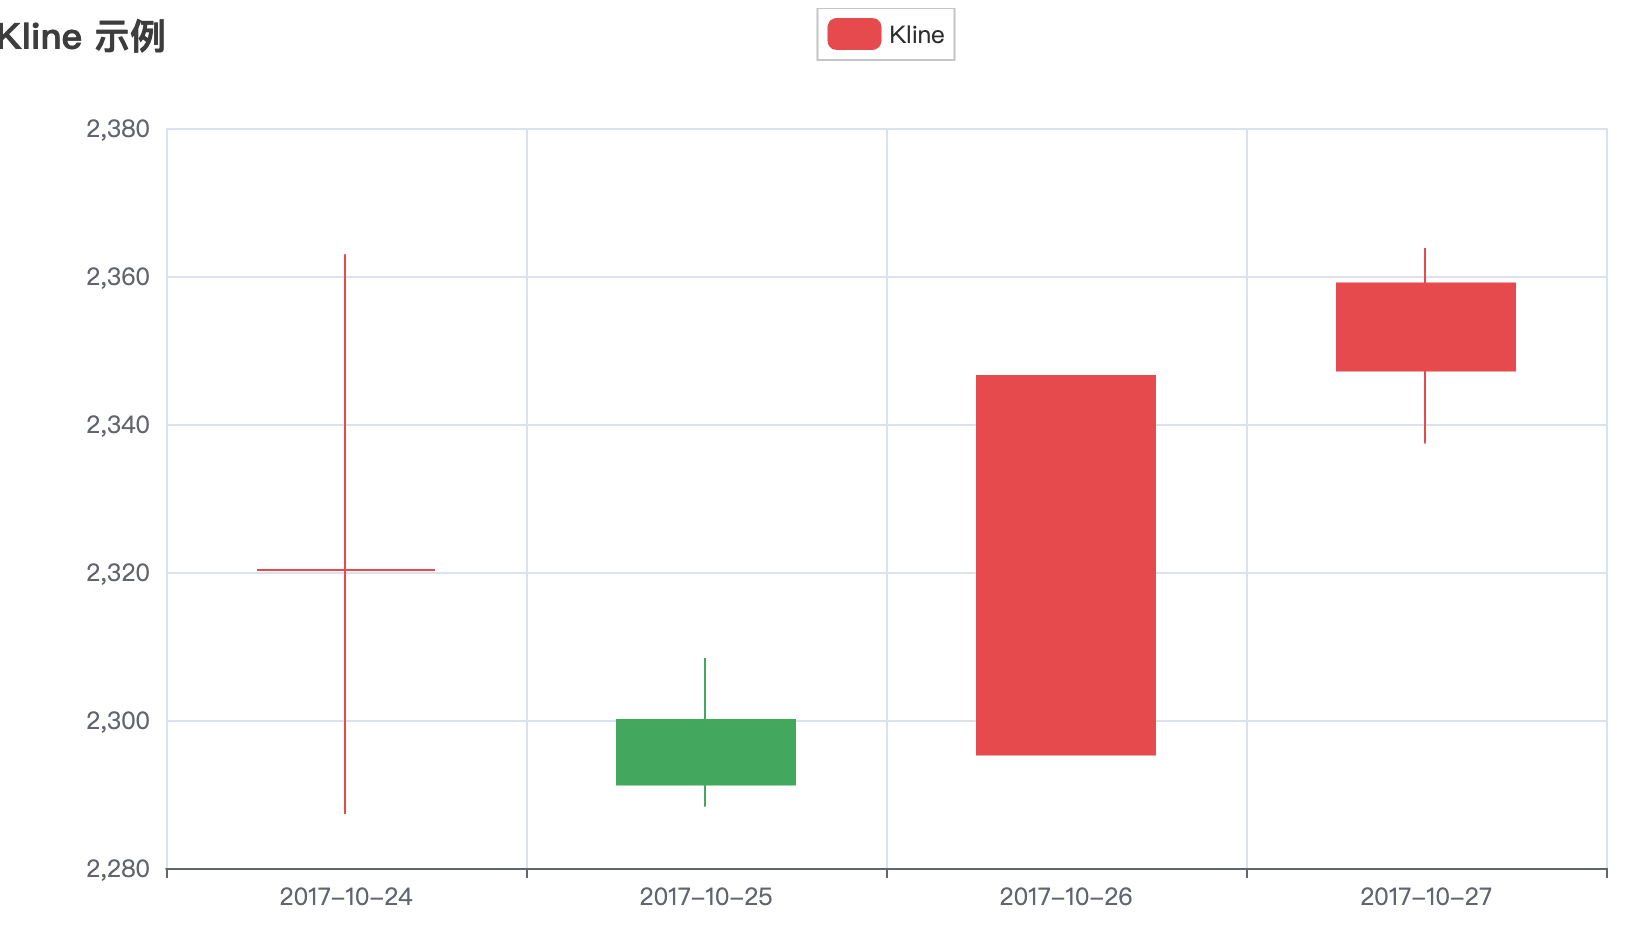
A kline_chart.html file will be generated in the current directory. Open the file and the chart will display as follows:
The following is an example code that demonstrates how to obtain Kweichow Moutai's stock data and generate a K-line chart:
Example
from pyecharts import options as opts
from pyecharts.charts import Kline
# Get Kweichow Moutai's stock data for the past three years
symbol = '600519.SS' # 600519.SS is the stock code for Kweichow Moutai
start_date = '2020-01-01'
end_date = '2022-12-31'
stock_data = yf.download(symbol, start=start_date, end=end_date)
# Extract the data format required for the K-line chart
kline_data = []
for index, row in stock_data.iterrows():
kline_data.append([row['Open'], row['Close'], row['Low'], row['High']])
# Configure the Kline chart
kline = (
Kline()
.add_xaxis(xaxis_data=stock_data.index.strftime('%Y-%m-%d').tolist())
.add_yaxis(series_name="Kline", y_axis=kline_data)
.set_global_opts(
xaxis_opts=opts.AxisOpts(is_scale=True),
yaxis_opts=opts.AxisOpts(is_scale=True),
title_opts=opts.TitleOpts(title="Kweichow Moutai Kline Chart Example"),
datazoom_opts=[opts.DataZoomOpts()],
toolbox_opts=opts.ToolboxOpts(
feature={
"dataZoom": {"yAxisIndex": "none"},
"restore": {},
"saveAsImage": {},
}
),
)
)
# Render the chart
kline.render("maotai_kline_chart.html")
A maotai_kline_chart.html file will be generated in the current directory. Open the file and the chart will display as follows:

Drawing a Line Chart
We can also use pyecharts to draw a simple line chart of a stock, taking Moutai (600519.SH) as an example:
Example
from pyecharts import options as opts
from pyecharts.charts import Line
from datetime import datetime, timedelta
# Set Moutai's stock code
stock_code = "600519.SS"
# Get the current date
end_date = datetime.now().strftime('%Y-%m-%d')
# Calculate the date three years ago
start_date = (datetime.now() - timedelta(days=3 * 365)).strftime('%Y-%m-%d')
# Use yfinance to get the stock data
df = yf.download(stock_code, start=start_date, end=end_date)
# Extract the dates and closing prices from the data
dates = df.index.strftime('%Y-%m-%d').tolist()
closing_prices = df['Close'].tolist()
# Create a Line chart
line_chart = Line()
line_chart.add_xaxis(xaxis_data=dates)
line_chart.add_yaxis(series_name="Moutai Stock Price Trend",
y_axis=closing_prices,
markline_opts=opts.MarkLineOpts(
data=[opts.MarkLineItem(type_="average", name="Average")]
)
)
line_chart.set_global_opts(
title_opts=opts.TitleOpts(title="Moutai Stock Price Trend Chart (Past Three Years)"),
xaxis_opts=opts.AxisOpts(type_="category"),
yaxis_opts=opts.AxisOpts(is_scale=True),
datazoom_opts=[opts.DataZoomOpts(pos_bottom="-2%")],
)
# Render the chart
line_chart.render("maotai_stock_trend_chart.html")
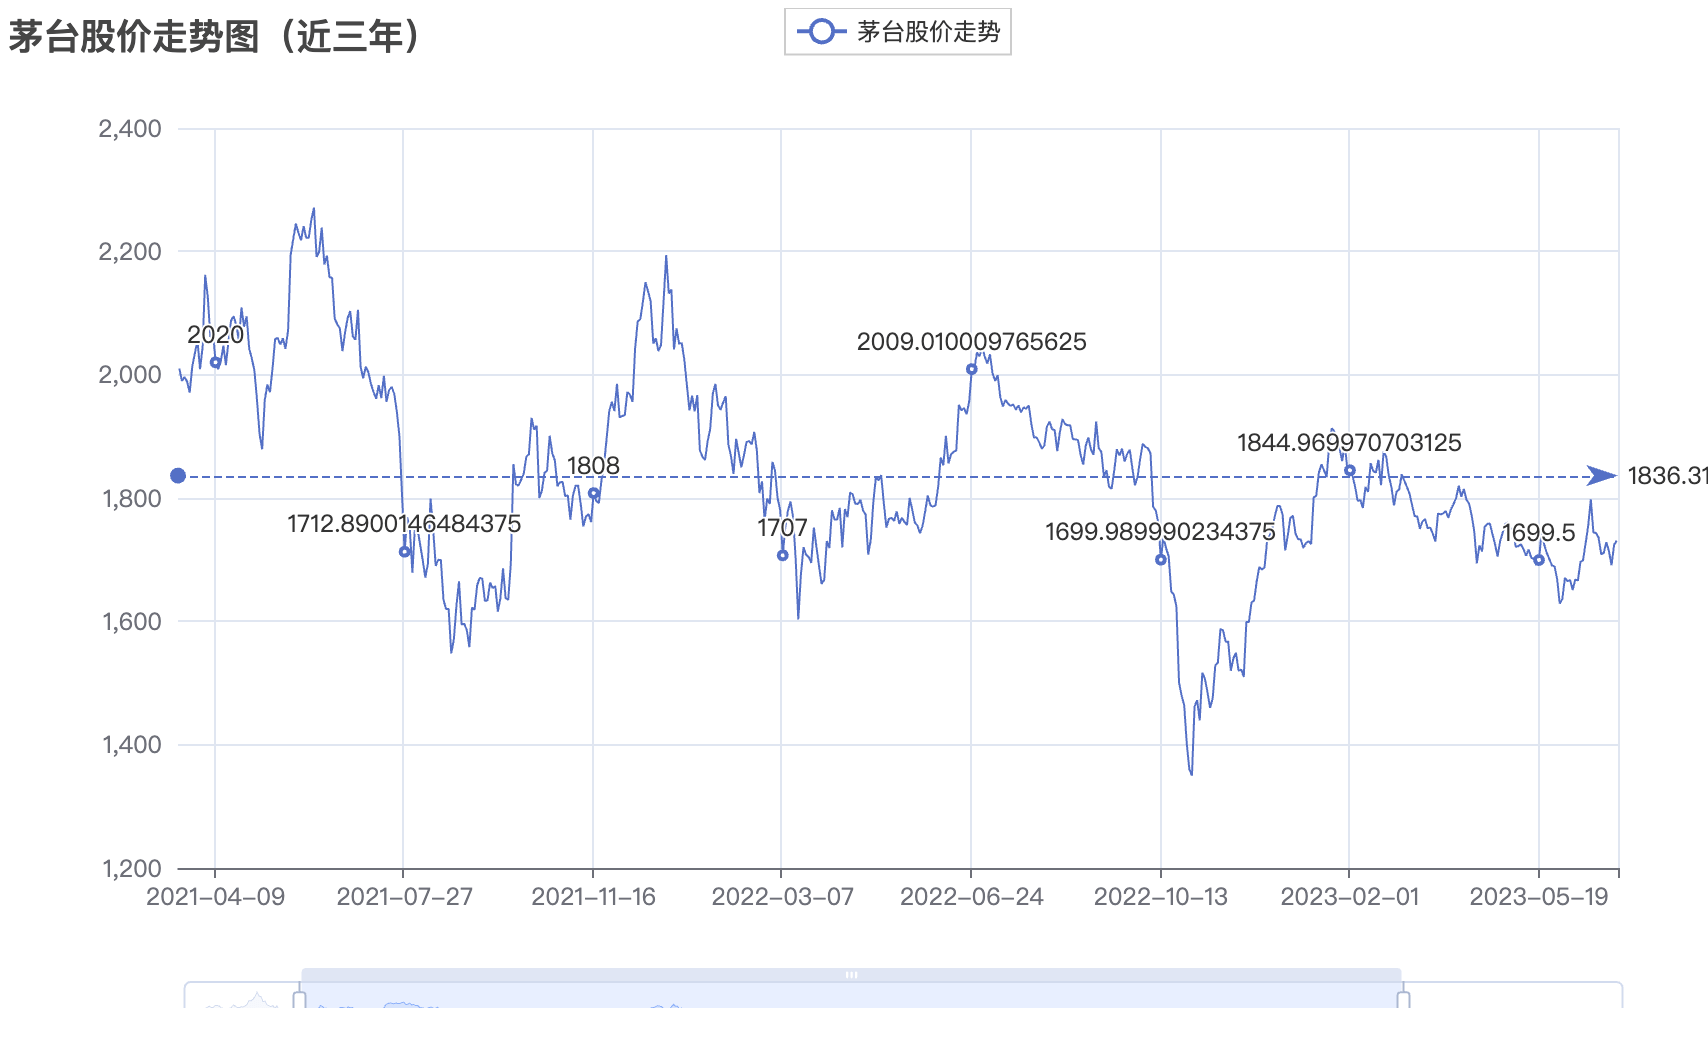
A maotai_stock_trend_chart.html file will be generated in the current directory. Open the file and the chart will display as follows:
You can consider adding some chart tools, such as data zoom, data view, etc., to enhance the user's interactive experience.
The following is the optimized code, with the data zoom and data view features added:
Example
from pyecharts import options as opts
from pyecharts.charts import Line
from pyecharts.commons.utils import JsCode
from datetime import datetime, timedelta
# Set Moutai's stock code
stock_code = "600519.SS"
# Get the current date
end_date = datetime.now().strftime('%Y-%m-%d')
# Calculate the date three years ago
start_date = (datetime.now() - timedelta(days=3 * 365)).strftime('%Y-%m-%d')
# Use yfinance to get the stock data
df = yf.download(stock_code, start=start_date, end=end_date)
# Extract the dates and closing prices from the data
dates = df.index.strftime('%Y-%m-%d').tolist()
closing_prices = df['Close'].tolist()
# Create a Line chart
line_chart = Line()
line_chart.add_xaxis(xaxis_data=dates)
line_chart.add_yaxis(series_name="Moutai Stock Price Trend",
y_axis=closing_prices,
markline_opts=opts.MarkLineOpts(
data=[opts.MarkLineItem(type_="average", name="Average")]
)
)
line_chart.set_global_opts(
title_opts=opts.TitleOpts(title="Moutai Stock Price Trend Chart (Past Three Years)"),
xaxis_opts=opts.AxisOpts(type_="category"),
yaxis_opts=opts.AxisOpts(is_scale=True),
datazoom_opts=[
opts.DataZoomOpts(
pos_bottom="-2%",
range_start=0,
range_end=100,
type_="inside"
),
opts.DataZoomOpts(
pos_bottom="-2%",
range_start=0,
range_end=100,
type_="slider",
),
],
toolbox_opts=opts.ToolboxOpts(
feature={
"dataZoom": {"yAxisIndex": "none"},
"restore": {},
"saveAsImage": {},
}
),
)
# Render the chart
line_chart.render("maotai_stock_trend_chart2.html")
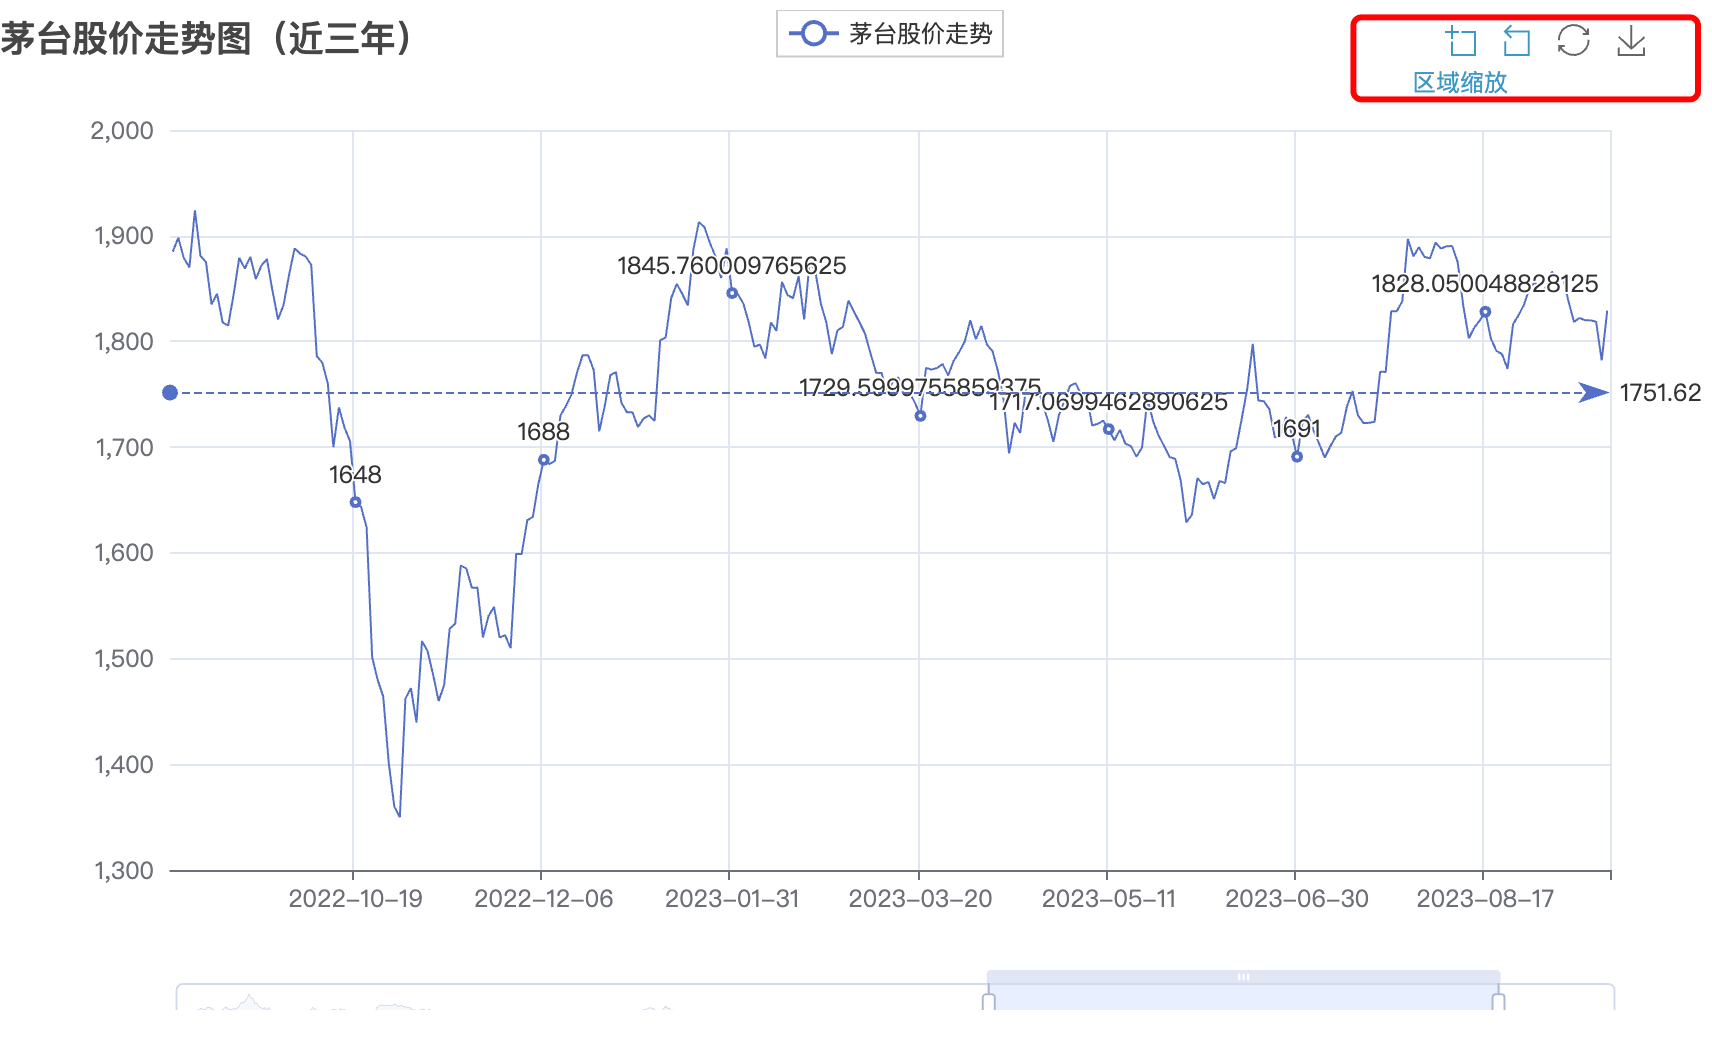
A maotai_stock_trend_chart2.html file will be generated in the current directory. Open the file and the chart will display as follows: