Python Fetching Financial Data
In this section, we first look at a simple Python quantitative trading example that uses the moving average strategy with Yahoo Finance data.
The basic idea of this strategy is to generate buy and sell signals by comparing short-term and long-term moving averages.
Before implementing this simple example, you need to install three packages:
pip install pandas numpy matplotlib yfinance
Package descriptions:
- pandasis a powerful open-source data processing and analysis library specifically designed for efficient data analysis and manipulation.
- numpyProvides support for arrays and matrices for mathematical calculations.
- yfinanceis a library for fetching financial data, supporting retrieval of stocks, indices, and other financial market data from Yahoo Finance.
- matplotlibis a 2D plotting library used to create static, animated, and interactive data visualization charts.
Fetch Historical Stock Data
Use yfinance to fetch historical stock data. Here is a simple example:
Example
# Fetch stock data
symbol = "600519.SS"
start_date = "2022-01-01"
end_date = "2023-01-01"
data = yf.download(symbol, start=start_date, end=end_date)
print(data.head())
The output is as follows:
                  Open         High          Low        Close    Adj Close   Volume
Date
2022-01-04  2055.00000  2068.949951  2014.000000  2051.229980  1973.508057  3384262
2022-01-05  2045.00000  2065.000000  2018.000000  2024.000000  1947.309937  2839551
2022-01-06  2022.01001  2036.000000  1938.510010  1982.219971  1907.112915  5179475
2022-01-07  1975.00000  1988.880005  1939.319946  1942.000000  1868.416870  2981669
2022-01-10  1928.01001  1977.000000  1917.550049  1966.000000  1891.507446  2962670
Simple Data Analysis and Visualization
Use pandas for data analysis and matplotlib for visualization:
Example
import pandas as pd
import matplotlib.pyplot as plt
# Fetch stock data
symbol = "600519.SS"
start_date = "2022-01-01"
end_date = "2023-01-01"
data = yf.download(symbol, start=start_date, end=end_date)
# Simple data analysis
print(data.describe())
# Plot stock price trend chart
data['Close'].plot(figsize=(10, 6), label=symbol)
plt.title(f"{symbol} Stock Price")
plt.xlabel("Date")
plt.ylabel("Price")
plt.legend()
plt.show()
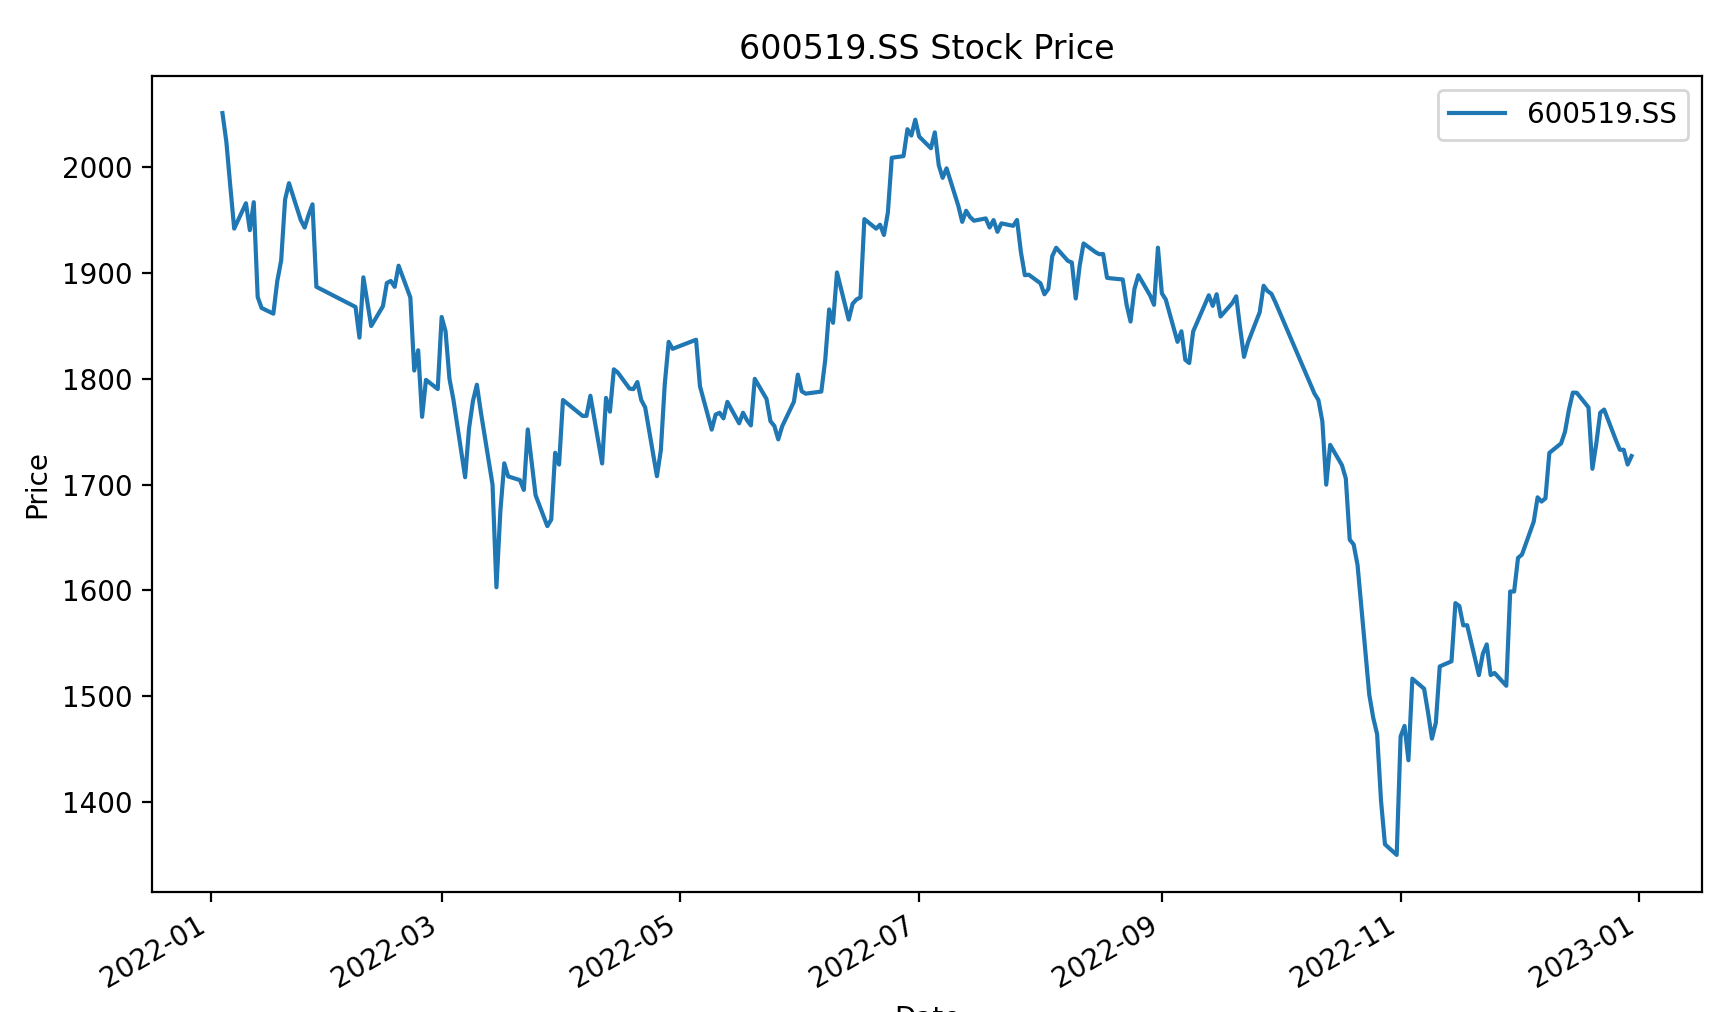
The trend chart is shown below:
Moving Average Crossover Strategy
Then, we can use the Yahoo Finance library (yfinance) to fetch stock data for Guizhou Moutai (600519.SS) and give a simple demonstration based on the moving average strategy:
Example
import yfinance as yf
import matplotlib.pyplot as plt
# Fetch Guizhou Moutai stock data
symbol = "600519.SS"
start_date = "2022-05-01"
end_date = "2023-12-01"
data = yf.download(symbol, start=start_date, end=end_date)
# Calculate short-term (50-day) and long-term (200-day) moving averages
data['MA_50'] = data['Close'].rolling(window=50).mean()
data['MA_200'] = data['Close'].rolling(window=200).mean()
# Generate buy/sell signals
data['Signal'] = 0
data['Signal'][data['MA_50'] > data['MA_200']] = 1 # Short-term MA crosses above long-term MA, generating a buy signal
data['Signal'][data['MA_50'] < data['MA_200']] = -1 # Short-term MA crosses below long-term MA, generating a sell signal
# Plot stock price and moving averages
plt.figure(figsize=(10, 6))
plt.plot(data['Close'], label='Close Price')
plt.plot(data['MA_50'], label='50-day Moving Average')
plt.plot(data['MA_200'], label='200-day Moving Average')
# Mark buy/sell signals
plt.scatter(data[data['Signal'] == 1].index, data[data['Signal'] == 1]['MA_50'], marker='^', color='g', label='Buy Signal')
plt.scatter(data[data['Signal'] == -1].index, data[data['Signal'] == -1]['MA_50'], marker='v', color='r', label='Sell Signal')
plt.title("Maotai Stock Price with Moving Averages")
plt.xlabel("Date")
plt.ylabel("Price (CNY)")
plt.legend()
plt.show()
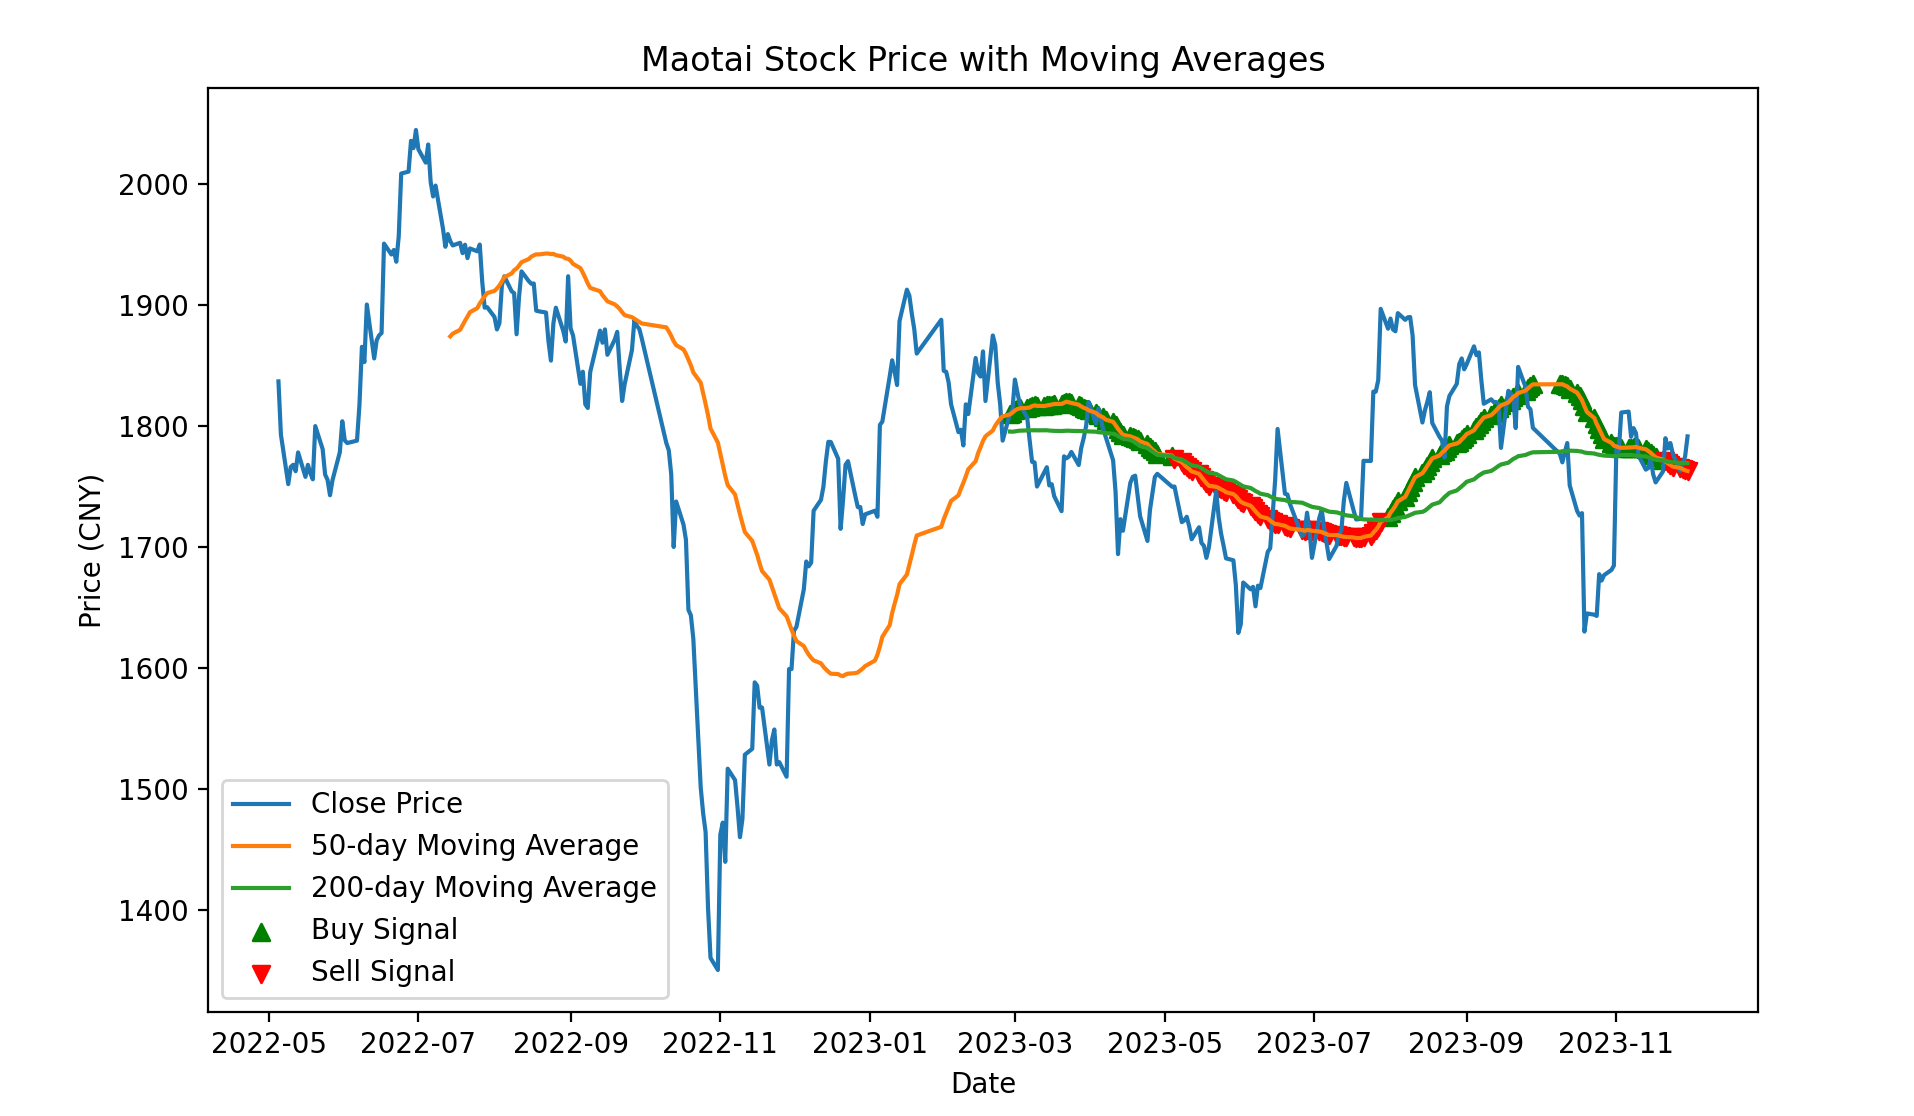
The example code above uses Guizhou Moutai (600519.SS) stock data to calculate 50-day and 200-day moving averages, and generates buy/sell signals by comparing the relationship between the two.
Finally, Matplotlib is used to plot the stock price trend chart and mark the buy/sell signals.
Remember to carefully research and test strategies in actual trading, and do not make real investments directly based on the above.
Execute the above code, the output chart is as follows: the green parts are buy signals, the red parts are sell signals. Click the image to zoom in for details:
Backtesting Strategy
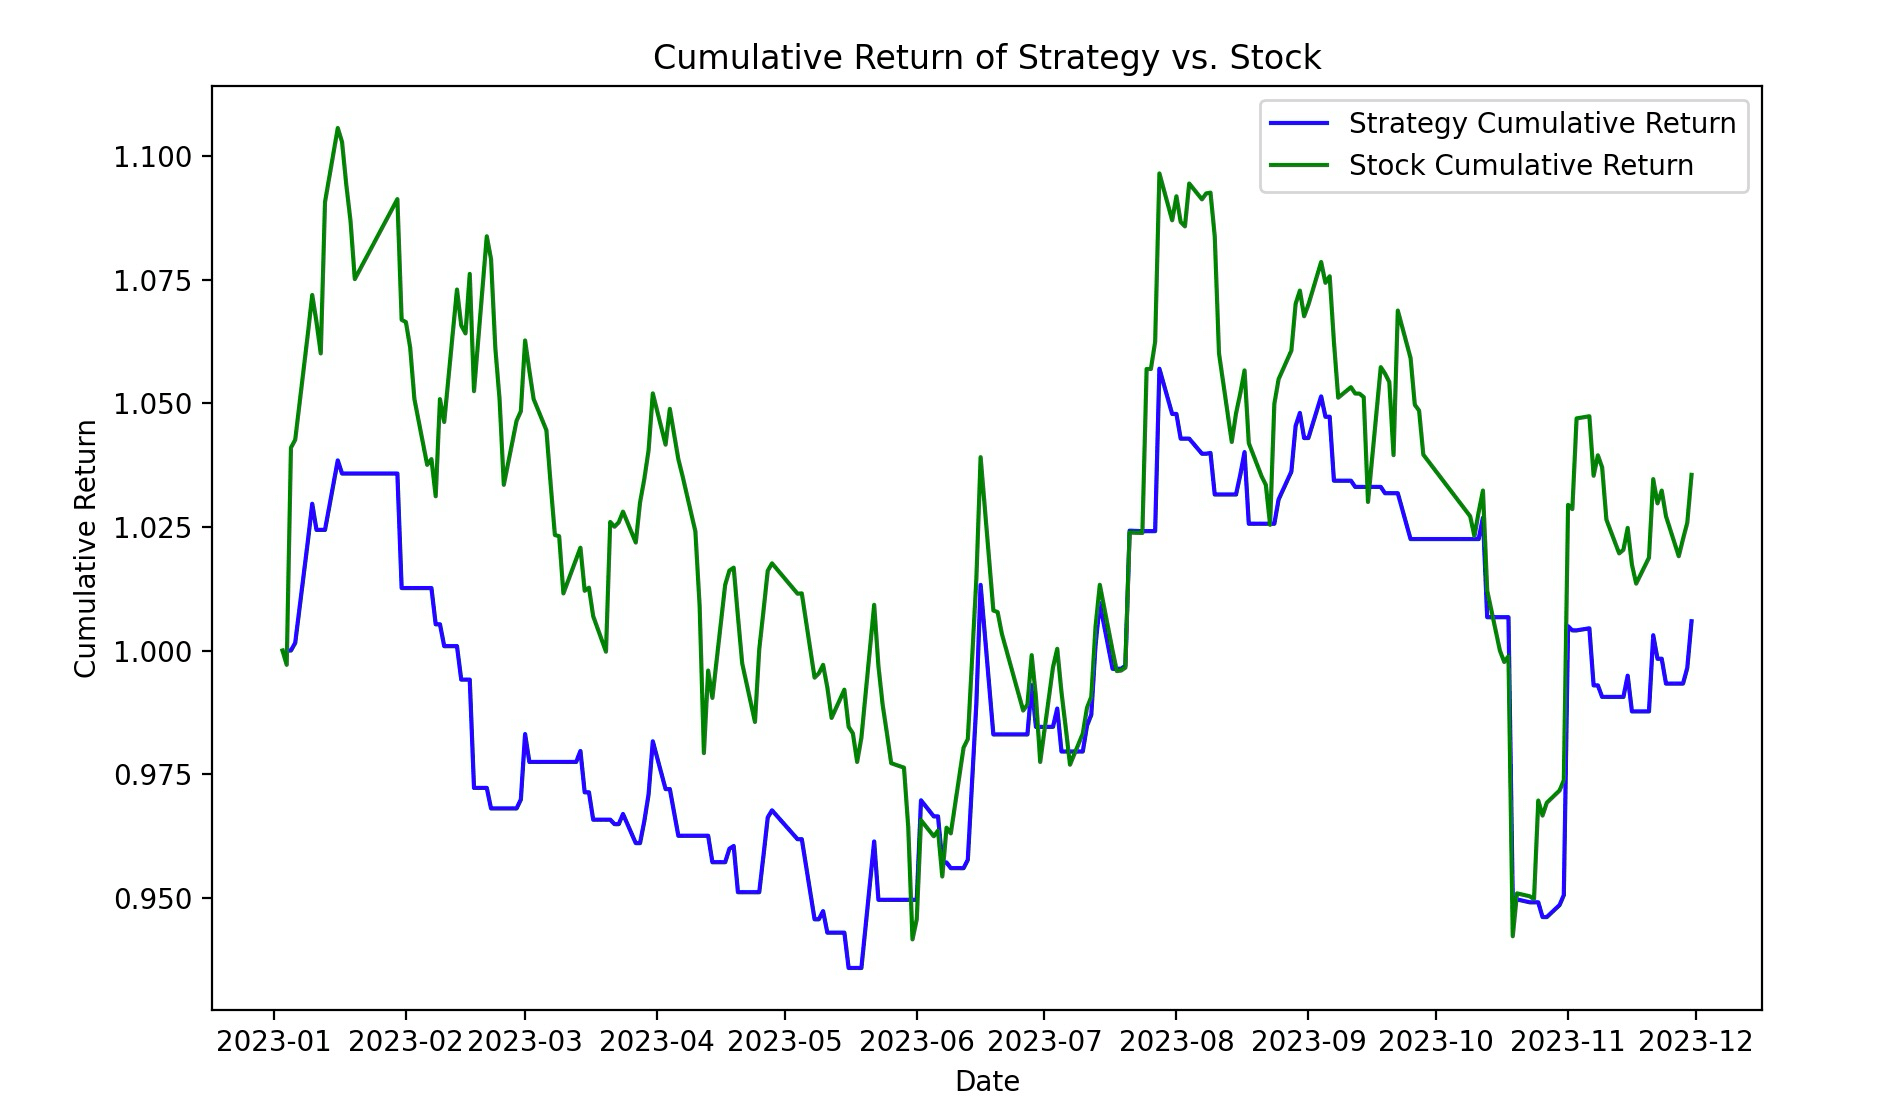
I used the positive or negative daily stock returns to generate trading signals to demonstrate a simple example. You can modify this condition according to your own strategy.
Example
import pandas as pd
import matplotlib.pyplot as plt
# Fetch stock data
symbol = "600519.SS"
start_date = "2023-01-01"
end_date = "2023-12-01"
data = yf.download(symbol, start=start_date, end=end_date)
# Initialize crossover signal column
data['Signal'] = 0
# Calculate daily returns
data['Daily_Return'] = data['Close'].pct_change()
# Calculate strategy signals
data['Signal'] = 0
data.loc[data['Daily_Return'] > 0, 'Signal'] = 1 # Use price increase as the signal; modify the condition as needed
# Calculate strategy returns
data['Strategy_Return'] = data['Signal'].shift(1) * data['Daily_Return']
# Calculate cumulative returns
data['Cumulative_Return'] = (1 + data['Strategy_Return']).cumprod()
# Plot cumulative return curve
plt.figure(figsize=(10, 6))
plt.plot(data['Cumulative_Return'], label='Strategy Cumulative Return', color='b')
plt.plot(data['Close'] / data['Close'].iloc[0], label='Stock Cumulative Return', color='g')
plt.title("Cumulative Return of Strategy vs. Stock")
plt.xlabel("Date")
plt.ylabel("Cumulative Return")
plt.legend()
plt.show()
Execute the above code, the output chart is as follows:
Basic Quantitative Trading Strategies
Quantitative trading is based on mathematical models, statistics, and computer algorithms, identifying and executing trading opportunities through systematic methods.
The following are some common basic quantitative trading strategies:
Quantitative trading is based on mathematical models, statistics, and computer algorithms, identifying and executing trading opportunities through systematic methods.
The following are some common basic quantitative trading strategies:
1. Moving Average Strategy
Strategy idea:Based on the historical average of stock prices, buy and sell signals are generated by calculating the difference between short-term and long-term moving averages.
Implementation method:Calculate short-term and long-term moving averages. When the short-term MA crosses above the long-term MA, a buy signal is generated; conversely, a sell signal is generated.
2. Mean Reversion Strategy
Strategy idea:Based on historical price fluctuations, it believes that prices will revert to their average level after fluctuating.
Implementation method:By calculating the difference between the price and the mean, a buy or sell signal is generated when the price deviates too far from the mean.
3. Momentum Strategy
Strategy idea:Based on price trends, it believes that price trends will continue for a period of time.
Implementation method:Buy or sell signals are generated by calculating the rate of change of price or other trend indicators.
4. Market Neutral Strategy
Strategy idea:By simultaneously buying and selling to take advantage of the relative strength of the market.
Implementation method:Generate trading signals based on the price spread or correlation between two or more related assets.
5. Statistical Arbitrage Strategy
Strategy idea:Based on statistical principles, look for temporary imbalances between prices to achieve arbitrage.
Implementation method:Generate trading signals by looking for outliers in prices, volatility, or other statistical indicators.
6. Event-Driven Strategy
Strategy idea:Generate trading signals based on the occurrence of specific events or information.
Implementation method:Monitor news, financial reports, economic indicators, etc., and execute trades when specific events occur.
7. Machine Learning Strategy
Strategy idea:Use machine learning algorithms to learn patterns from large amounts of data and predict future price trends.
Implementation method:Use regression, classification, or deep learning models, and train the models to predict market trends.
8. High-Frequency Trading Strategy
Strategy idea:Exploit small price differences within extremely short periods by quickly executing a large number of trades.
Implementation method:Use high-performance algorithms and fast execution systems, usually involving a large number of trades and low holding periods.
These strategies are only a small part of the quantitative trading field. In fact, quantitative trading strategies come in many forms and can be adjusted according to the market, asset class, and trader preferences. Importantly, the design of quantitative strategies requires thorough backtesting and risk management considerations to ensure their effectiveness in different market environments.
Other Extensions