LaTeX Figures and Tables
Figures and tables are the backbone of a paper. This article covers four things: figure insertion commands and floats, basic tables, the academic-standard three-line table, and merging cells.
LaTeX's management philosophy for figures and tables is consistent with its numbering: you only need to provide the content and title; position, numbering, and references are all automatic.
Inserting Images: graphicx Package
Inserting figures requires only two commands: load graphicx in the preamble, and use \includegraphics in the body to place the image file.
| Common Options | Meaning | Example |
|---|---|---|
| width | Width, relative values allowed | width=0.8\textwidth (80% of the text width) |
| height | Height | height=5cm |
| scale | Scale factor | scale=0.5 |
| angle | Rotation angle | angle=90 |
Filename RecommendationsOmitting the extension: write sin rather than sin.png. LaTeX will automatically search for a format supported by the current compiler (XeLaTeX supports PDF, PNG, JPG, etc.), so you don't need to change the source when switching formats.
When controlling image size, prefer a proportional value like width=\textwidth over scale—the former guarantees the image never exceeds the text width, while the latter may unexpectedly overflow under different font-size settings.
Floats: figure Environment
Images should not sit directly in the text flow; the standard practice is to place them in a figure float environment.
Example: Standard Figure
\usepackage{graphicx} % Required package for figures
\begin{document}
The sine function$y = \sin x$is shown in Figure~\ref{fig:sin}.
\begin{figure}[htbp] % Float environment, placement parameter see table below
\centering % Center the image inside the float
\includegraphics[width=0.6\textwidth]{sin}
\caption{Sine function curve} % Caption, number generated automatically
\label{fig:sin} % Label, for referencing with \ref
\end{figure}
\end{document}
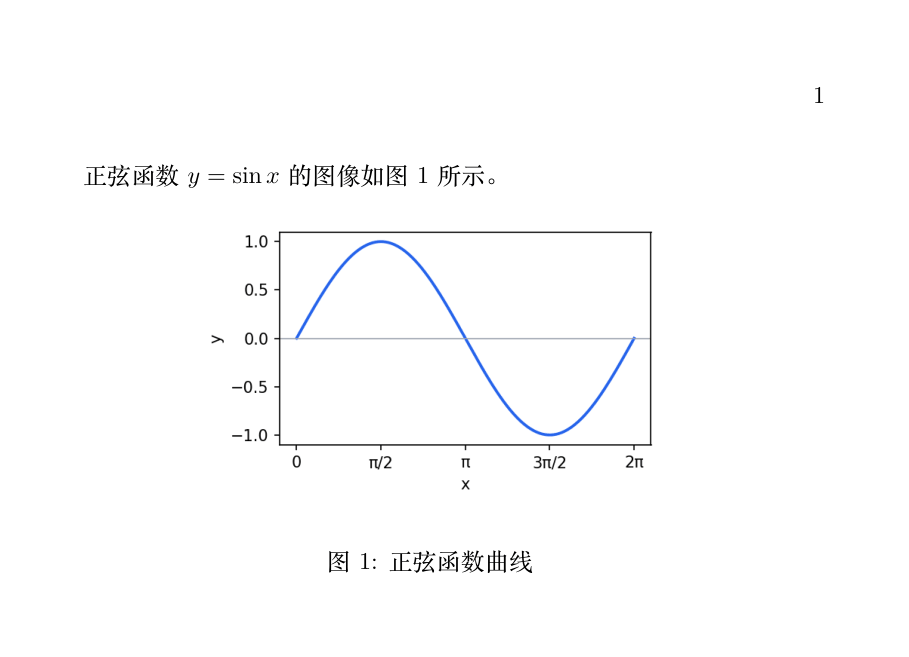
The brackets after the environment name are "placement suggestions," telling LaTeX where you'd like it to appear.
| Parameter | Meaning | Priority Notes |
|---|---|---|
| h | here, right at the source position | Just a suggestion; LaTeX will adjust on its own if the layout can't fit it |
| t | top, top of the current page | The most common choice in academic papers |
| b | bottom, bottom of the current page | Often combined with t |
| p | float page, a dedicated float page | Automatically groups many figures/tables into an appendix page |
| ! (e.g., [!h]) | Relax typesetting constraints | Use together when making a strong request |
"Why did my figure move somewhere else?"—This is not a bug; it's the float mechanism at work: LaTeX chooses a position for each figure that doesn't create large gaps. If you really need to pin it down, use the [H] parameter from the float package (capital H, meaning "here" and don't move it).
Basic Tables: tabular Environment
The syntax skeleton of a table is the same as a matrix: & separates columns, \\ starts a new row, and the column format is declared in the environment parameters.
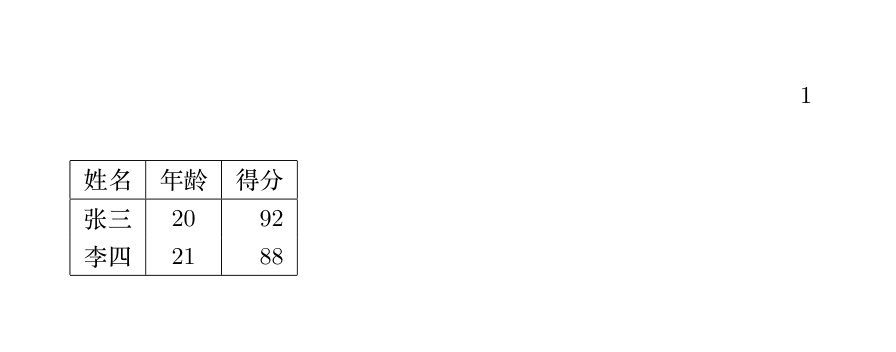
Example: Table with Full Borders
\begin{document}
\begin{tabular}{|l|c|r|} % Column format: left-aligned, centered, right-aligned, separated by vertical lines
\hline % Top horizontal line
Name&Age&Score\\ % & separates columns, \\ starts a new row
\hline
Zhang San& 20 & 92 \\
Li Si& 21 & 88 \\
\hline % Bottom horizontal line
\end{tabular}
\end{document}
| Column Format Symbols | Meaning |
|---|---|
| l / c / r | Left-align / center / right-align the column |
| | | Draw a vertical line at that position |
| p{2cm} | Fixed column width with automatic line wrapping inside cells |
Academic Standard: booktabs Three-line Table
Open any professional publication, and the tables have "three horizontal lines and zero vertical lines"—this is called a three-line table, provided by the booktabs package.
Example: Three-line Table
\usepackage{booktabs} % Dedicated package for three-line tables
\begin{document}
\begin{tabular}{lccc} % Three-line tables use no vertical lines
\toprule % Top line, thickest
Algorithm&Accuracy&Recall& F1 \\
\midrule % Middle line, thinner
Model A& 0.91 & 0.88 & 0.89 \\
Model B& 0.93 & 0.90 & 0.91 \\
\bottomrule % Bottom line, thickest
\end{tabular}
\end{document}
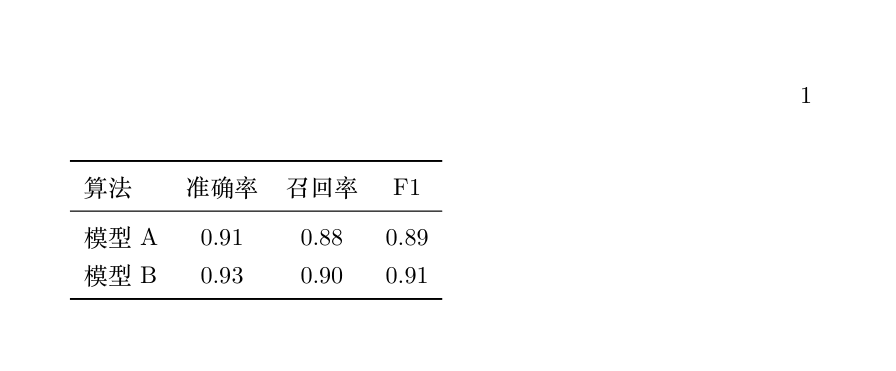
Format guidelines for journals and theses almost universally require three-line tables. Using | and \hline to create full-border tables is fine for everyday homework, but be sure to switch to booktabs before submitting—vertical lines in professional typography are a sign of "amateur."
Merging Cells: multirow and multicolumn
Complex headers require merging: use \multicolumn for horizontal merging (built into LaTeX) and \multirow for vertical merging (requires loading the multirow package).
Example: Two-level Header
\usepackage{booktabs}
\usepackage{multirow} % Vertically merge cells
\begin{document}
\begin{tabular}{lcc}
\toprule
\multirow{2}{*}{Dataset} & \multicolumn{2}{c}{Accuracy} \\
\cmidrule(lr){2-3} % Draw a partial horizontal line only across columns 2-3
&Training set&Test set\\
\midrule
MNIST & 0.99 & 0.98 \\
CIFAR-10 & 0.95 & 0.91 \\
\bottomrule
\end{tabular}
\end{document}
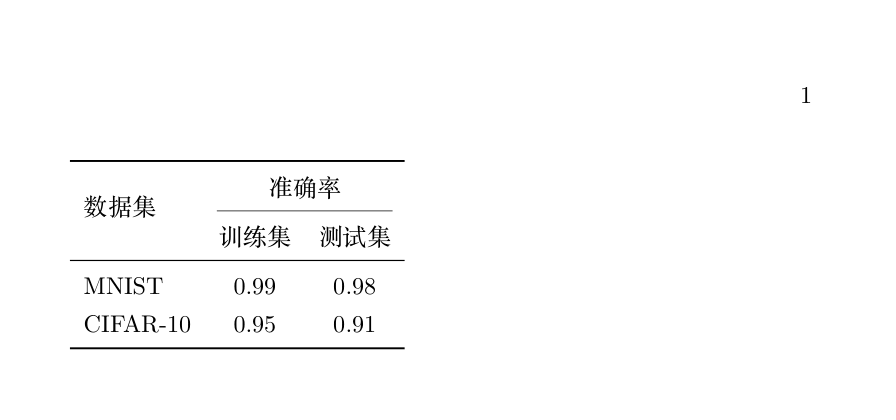
| Command | Syntax | Description |
|---|---|---|
| \multirow | \multirow{num rows}{*}{content} | Spans rows vertically; leave the corresponding positions empty in the spanned rows |
| \multicolumn | \multicolumn{num cols}{column format}{content} | Spans columns horizontally; you must rewrite the column format for that cell |
| \cmidrule | \cmidrule(lr){2-3} | Partial horizontal line; (lr) leaves a small gap at both ends for a more refined look |
Table Captions and Overall Floats
Tables also live in a float; the environment is table, and everything else works exactly like figure.
Example: Numbered Table
\centering % Center the entire table
\caption{Comparison of Experimental Results} % Table caption (conventionally placed above the table)
\label{tab:result}
\begin{tabular}{lcc}
\toprule
Dataset&Training set&Test set\\
\midrule
MNIST & 0.99 & 0.98 \\
\bottomrule
\end{tabular}
\end{table}
Two unwritten conventions: place the table captionabove the table, and the figure captionbelow the figure; use tab: and fig: as label prefixes for tables and figures respectively, so you can tell the type at a glance when referencing.
When a table is wider than the text area, there are two quick fixes: wrap the entire tabular in \resizebox{\textwidth}{!}{...} for proportional scaling; or switch to the tabularx package to automatically distribute column widths. The former is fast, the latter is more proper.
Summary
| Requirement | Command / Environment |
|---|---|
| Inserting figures | \includegraphics[width=0.8\textwidth]{filename} |
| Figure/table floats | figure / table + [htbp] + \centering + \caption + \label |
| Table skeleton | tabular, & separates columns, \\ starts a new row |
| Three-line table | booktabs:\toprule \midrule \bottomrule |
| Merging cells | \multirow、\multicolumn |
| Partial horizontal line | \cmidrule(lr){2-3} |