Eclipse Debugging
Debug Java Programs
We can debug Java programs in the Package Explorer view. The steps are as follows:
- Right-click the Java class that contains the main method.
- Select Debug As > Java Application
This operation can also be done via a keyboard shortcut. The shortcut combination is Alt + Shift + D, J.
The above operation will create a newDebug Configuration, and use this configuration to launch the Java application.
If the Debug Configuration has already been created, you can select Debug Configurations from the Run menu, choose the corresponding class, and click the Debug button to launch the Java application.
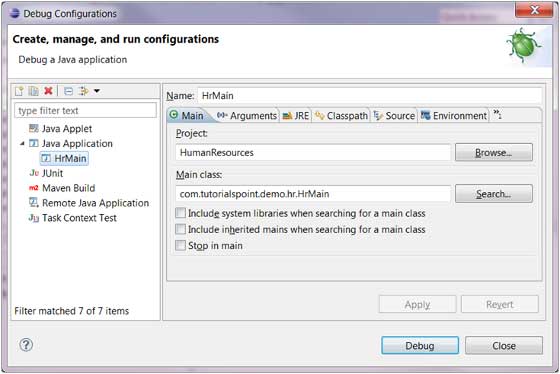
The Debug menu item in the Run menu can relaunch the Java application that previously used debug mode.
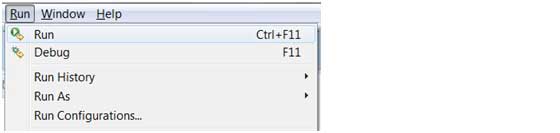
The shortcut for relaunching the Java application that previously used debug mode is F11.
When starting a Java program in debug mode, the user is prompted to switch to the Debug perspective. The Debug perspective provides additional views for troubleshooting application faults.
The Java editor supports setting breakpoints for debugging. Right-click the marker bar in the editor and select Toggle Breakpoint to set a breakpoint for debugging.
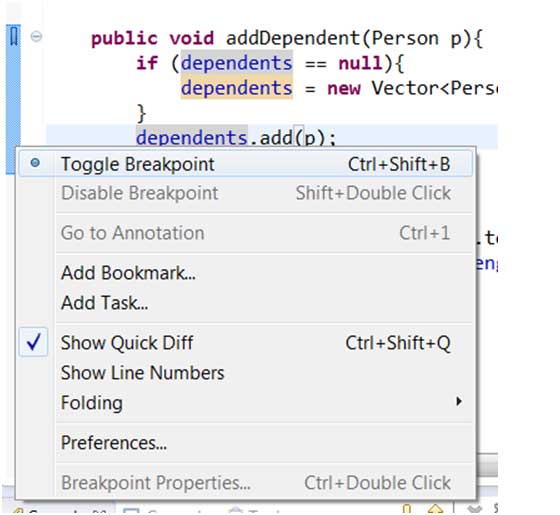
Breakpoints can be seen in the marker bar. They can also be seen in the Breakpoints View.
When the program execution reaches the code marked by a breakpoint, the JVM will suspend the program. At this point, you can view memory usage and control program execution.
When the program is suspended, the Debug view can inspect the call stack.
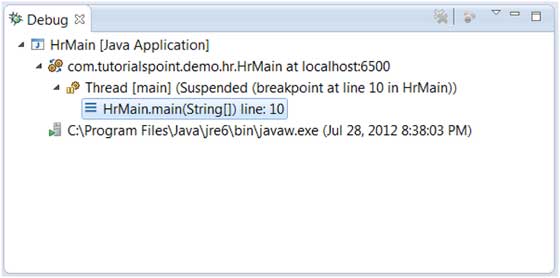
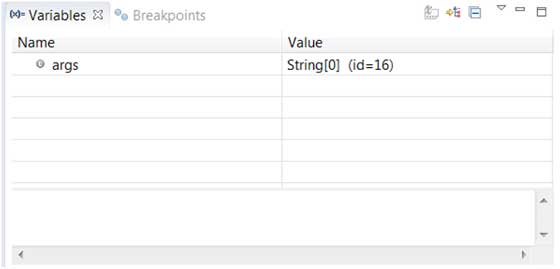
The Variables view can view the values of variables.
The Run menu has menu items such as Resume, Step Over to skip one line of code, Step Into to enter a function, etc.
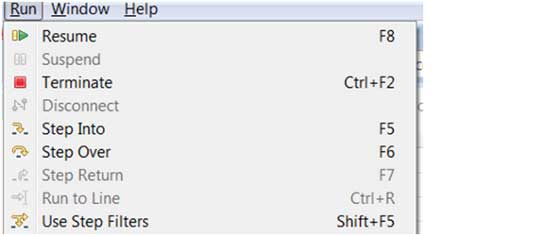
The images above show the associated shortcut operations such as Resume, Step Into, and Step Over.
other extensions