Dash Data Visualization with Plotly Integration
In the field of data science and analytics, data visualization is a crucial component. Through visualization, we can understand data more intuitively and uncover patterns and trends within it.
Dash's core visualization capabilities rely on Plotly, a powerful open-source data visualization library. Plotly provides a rich variety of chart types and highly customizable options, making it easy to create interactive charts.
Dash seamlessly integrates with Plotly through the dcc.Graph component, allowing users to embed Plotly charts directly in Dash applications.
What is Plotly?
Plotly is a JavaScript-based open-source data visualization library that supports multiple programming languages, including Python, R, Julia, and others.
Plotly offers a wide range of chart types, such as line charts, bar charts, scatter plots, heatmaps, and more, and supports interactive features like zooming, panning, and hover tooltips.
Plotly features:
Rich chart types: Line charts, bar charts, scatter plots, pie charts, heatmaps, 3D charts, and more.
interactivity: Supports interactive features such as zooming, panning, and hover tooltips.
Highly customizable: Allows customization of chart colors, layout, annotations, and more.
Seamless integration with Dash: through
dcc.GraphComponent embeds Plotly charts directly in Dash applications.
Plotly's core advantages
- interactivity: Plotly charts support rich interactive features, allowing users to interact with charts through mouse operations.
- diversity: Plotly provides multiple chart types suitable for different data visualization needs.
- usability: Plotly's API design is concise and easy to get started with, while also supporting advanced customization.
Dash and Plotly Integration
1. Install Dash and Plotly
Before we begin, we need to install Dash and Plotly. This can be done using the following commands:
pip install dash plotly
或
pip3 install dash plotly
dcc.GraphIt is a component in Dash used to display Plotly charts. Its core parameter is figure, which specifies the chart's data and layout.
figure parameters:
data: The data portion of the chart, which is a list of dictionaries, where each dictionary represents a data series.layout: The layout portion of the chart, used to set the title, axes, legend, and more.
Example
from dash import dcc, html
import plotly.express as px
# Create Dash App
app = dash.Dash(__name__)
# Define Layout
app.layout = html.Div([
dcc.Graph(
id='example-graph',
figure={
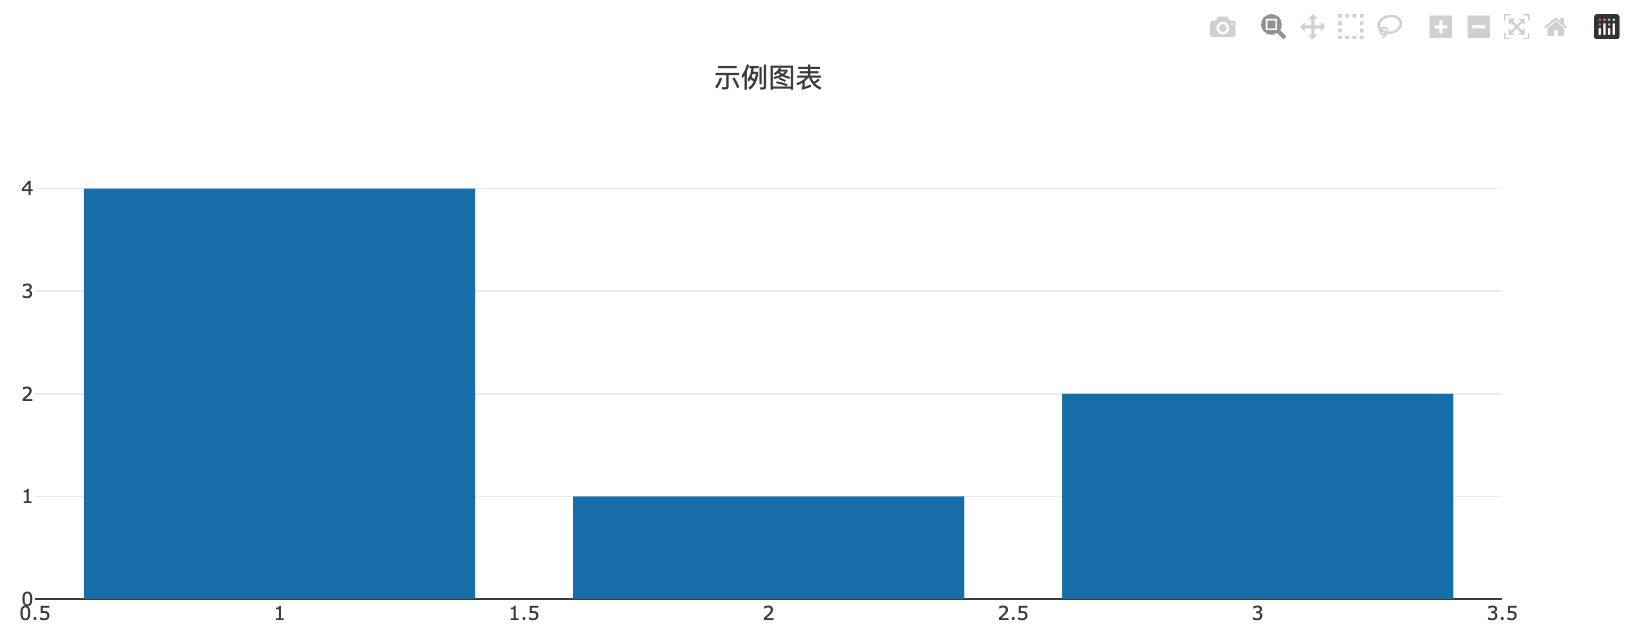
'data': [{'x': [1, 2, 3], 'y': [4, 1, 2], 'type': 'bar', 'name': 'Data 1'}],
'layout': {'title': 'Example Chart'}
}
)
])
# Run the app
if __name__ == '__main__':
app.run_server(debug=True)
The display effect is as follows:
2. Create a Simple Dash Application
First, we create a simple Dash application that displays a basic Plotly chart.
Example
from dash import dcc, html
import plotly.express as px
import pandas as pd
# Create a sample dataset
df = pd.DataFrame({
"Fruit": ["Apples", "Oranges", "Bananas", "Apples", "Oranges", "Bananas"],
"Amount": [4, 1, 2, 2, 4, 5],
"City": ["SF", "SF", "SF", "NYC", "NYC", "NYC"]
})
# Create a Plotly chart
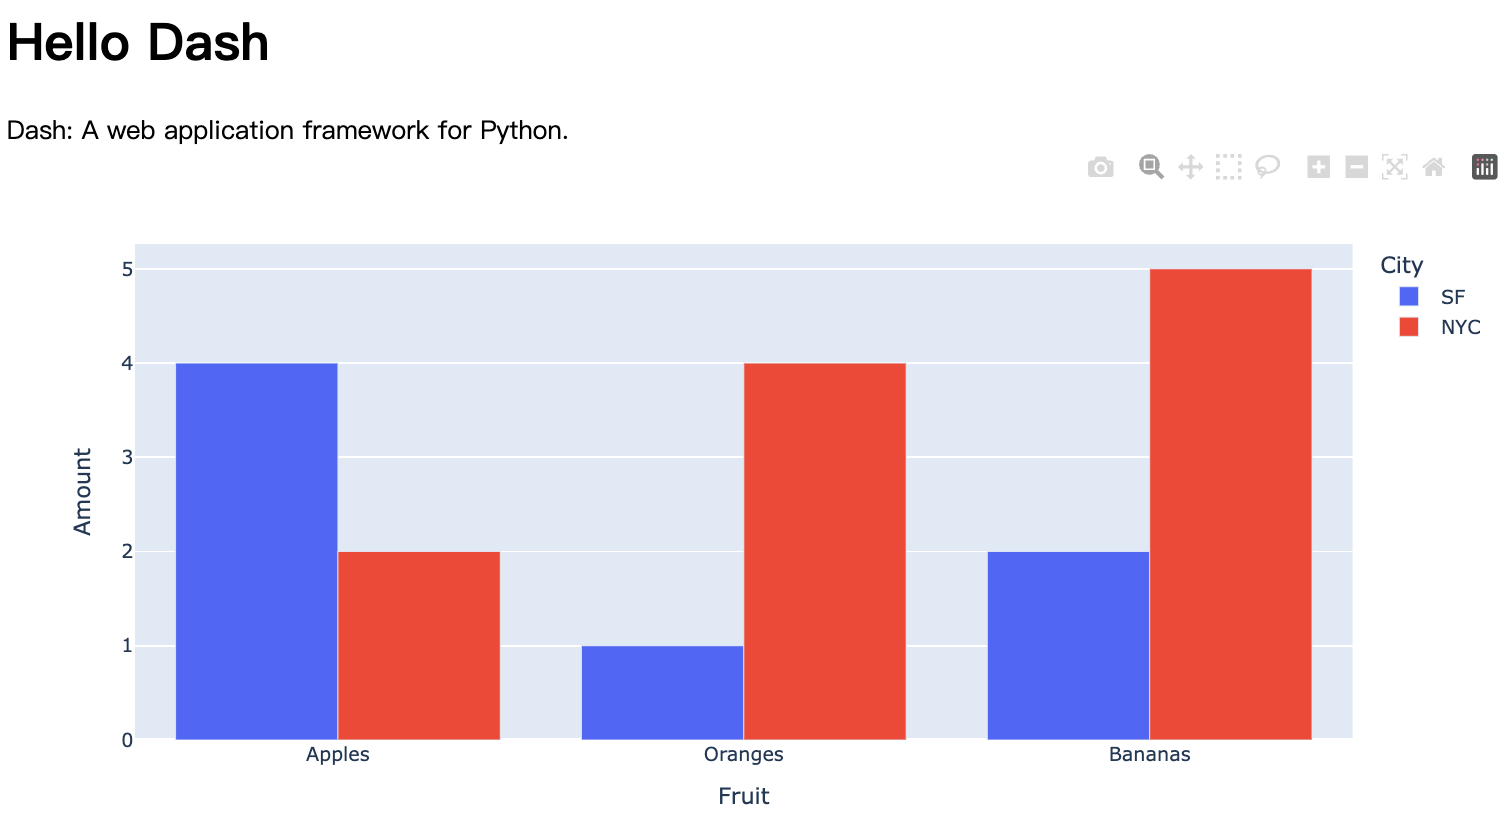
fig = px.bar(df, x="Fruit", y="Amount", color="City", barmode="group")
# Initialize Dash application
app = dash.Dash(__name__)
# Define the application layout
app.layout = html.Div(children=[
html.H1(children='Hello Dash'),
html.Div(children='''
Dash: A web application framework for Python.
'''),
dcc.Graph(
id='example-graph',
figure=fig
)
])
# Run the app
if __name__ == '__main__':
app.run_server(debug=True)
Code analysis:
- Dataset creation: We use
pandasCreated a simple datasetdf, containing fruit, quantity, and city information. - Chart Creation: Use
plotly.expressofpx.barThe function creates a bar chart showing the quantities of various fruits in different cities. - Dash application layout: Use
html.Divanddcc.GraphDefined the application layout, in whichdcc.GraphUsed for embedding Plotly charts. - Run the application: Through
app.run_server(debug=True)Start the application and enable debug mode.
The display effect is as follows:
3. Add interactive functionality
The power of Dash lies in its interactive features; we can dynamically update chart content through Dash's callback mechanism.
Example
# Update the application's layout to add a dropdown menu
app.layout = html.Div(children=[
html.H1(children='Hello Dash'),
html.Div(children='''
Dash: A web application framework for Python.
'''),
dcc.Dropdown(
id='city-dropdown',
options=[
{'label': 'San Francisco', 'value': 'SF'},
{'label': 'New York City', 'value': 'NYC'}
],
value='SF'
),
dcc.Graph(
id='example-graph',
)
])
# Define the callback function
@app.callback(
Output('example-graph', 'figure'),
[Input('city-dropdown', 'value')]
)
def update_graph(selected_city):
filtered_df = df[df['City'] == selected_city]
fig = px.bar(filtered_df, x="Fruit", y="Amount", color="City", barmode="group")
return fig
# Run the app
if __name__ == '__main__':
app.run_server(debug=True)
Code Analysis:
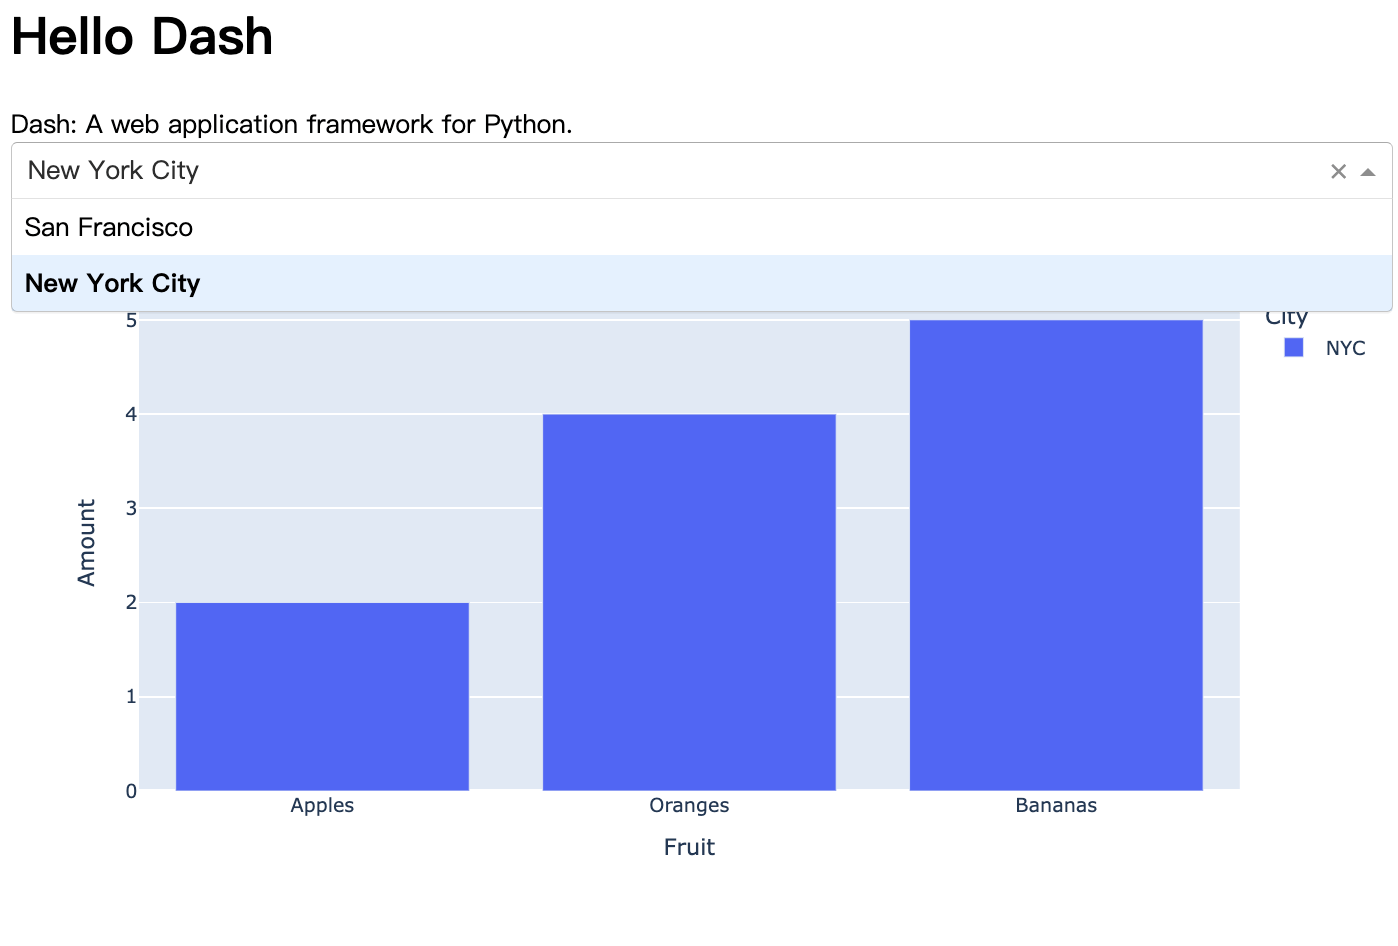
- dropdown menu: Added a
dcc.DropdownComponent, users can select different cities. - callback function: Use
@app.callbackThe decorator defines a callback functionupdate_graph, when the user selects a different city, the chart updates dynamically. - Chart Update: The callback function filters the dataset based on the user-selected city and updates the chart.
The display effect is as follows:
Plotly Express
Plotly Express is Plotly's high-level interface, capable of creating complex charts with minimal code. It is well-suited for rapid prototyping.
Common chart types
1. Line chart (px.line):
import plotly.express as px
df = px.data.iris()
fig = px.line(df, x='sepal_width', y='sepal_length', title='折线图示例')
2. Bar chart (px.bar):
fig = px.bar(df, x='species', y='sepal_length', title='柱状图示例')
3. Scatter plot (px.scatter):
fig = px.scatter(df, x='sepal_width', y='sepal_length', color='species', title='散点图示例')
4. Pie Chart (px.pie):
fig = px.pie(df, names='species', values='sepal_length', title='饼图示例')
5. Heatmap (px.imshow):
import numpy as np
data = np.random.rand(10, 10)
fig = px.imshow(data, title='热力图示例')
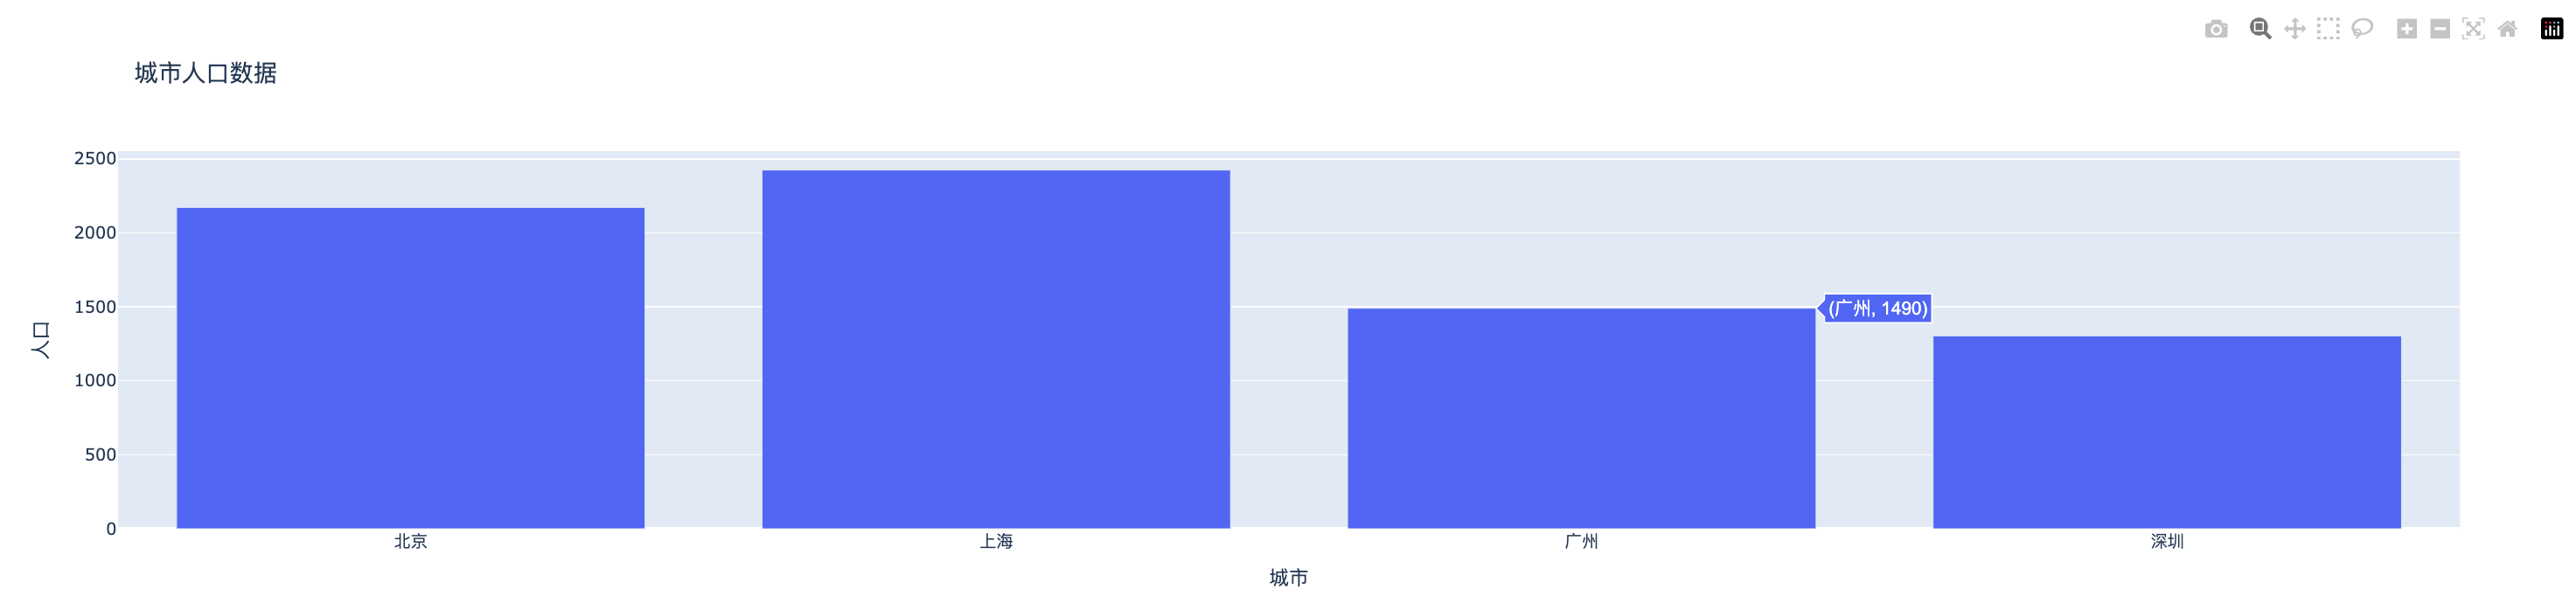
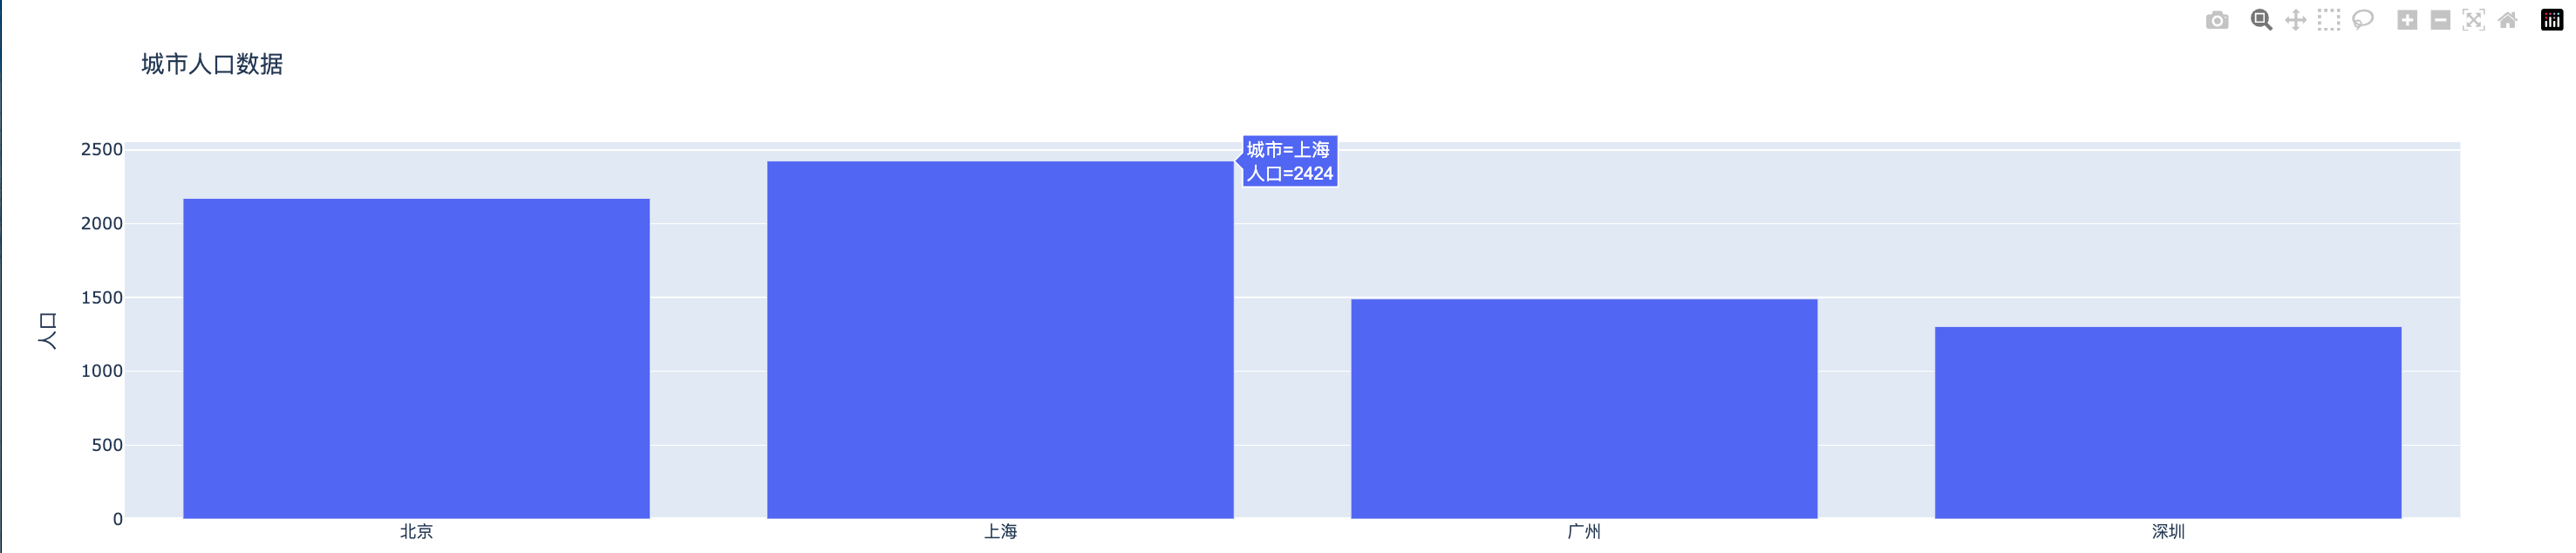
The following is a complete Dash application example that uses Plotly Express to create charts:
Example
import plotly.express as px
import pandas as pd
# Create sample data
df = pd.DataFrame({
'city': ['Beijing', 'Shanghai', 'Guangzhou', 'Shenzhen'],
'Population': [2171, 2424, 1490, 1303]
})
# Create Dash App
app = Dash(__name__)
# Using Plotly Express to create a bar chart
fig = px.bar(df, x='city', y='Population', title=City population data)
# Define Layout
app.layout = html.Div([
dcc.Graph(id='example-graph', figure=fig)
])
# Run the app
if __name__ == '__main__':
app.run_server(debug=True)
Displayed as follows:
Using Plotly Graph Objects
Plotly Graph Objects is Plotly's low-level interface, providing more fine-grained control and suitable for scenarios requiring a high degree of customization.
Common chart types
1. Line chart (go.Scatter):
import plotly.graph_objects as go
fig = go.Figure(data=go.Scatter(x=[1, 2, 3], y=[4, 1, 2], mode='lines'))
2. Bar chart (go.Bar):
fig = go.Figure(data=go.Bar(x=['A', 'B', 'C'], y=[10, 20, 30]))
3. Scatter plot (go.Scatter):
fig = go.Figure(data=go.Scatter(x=[1, 2, 3], y=[4, 1, 2], mode='markers'))
4. Pie Chart (go.Pie):
fig = go.Figure(data=go.Pie(labels=['A', 'B', 'C'], values=[10, 20, 30]))
The following is a complete Dash application example that uses Plotly Graph Objects to create charts:
Example
import plotly.graph_objects as go
# Create Dash App
app = Dash(__name__)
# Using Plotly Graph Objects to Create Bar Charts
fig = go.Figure(data=go.Bar(x=['Beijing', 'Shanghai', 'Guangzhou', 'Shenzhen'], y=[2171, 2424, 1490, 1303]))
# Set chart layout
fig.update_layout(title=City population data, xaxis_title='city', yaxis_title='Population')
# Define Layout
app.layout = html.Div([
dcc.Graph(id='example-graph', figure=fig)
])
# Run the app
if __name__ == '__main__':
app.run_server(debug=True)
Displayed as follows: